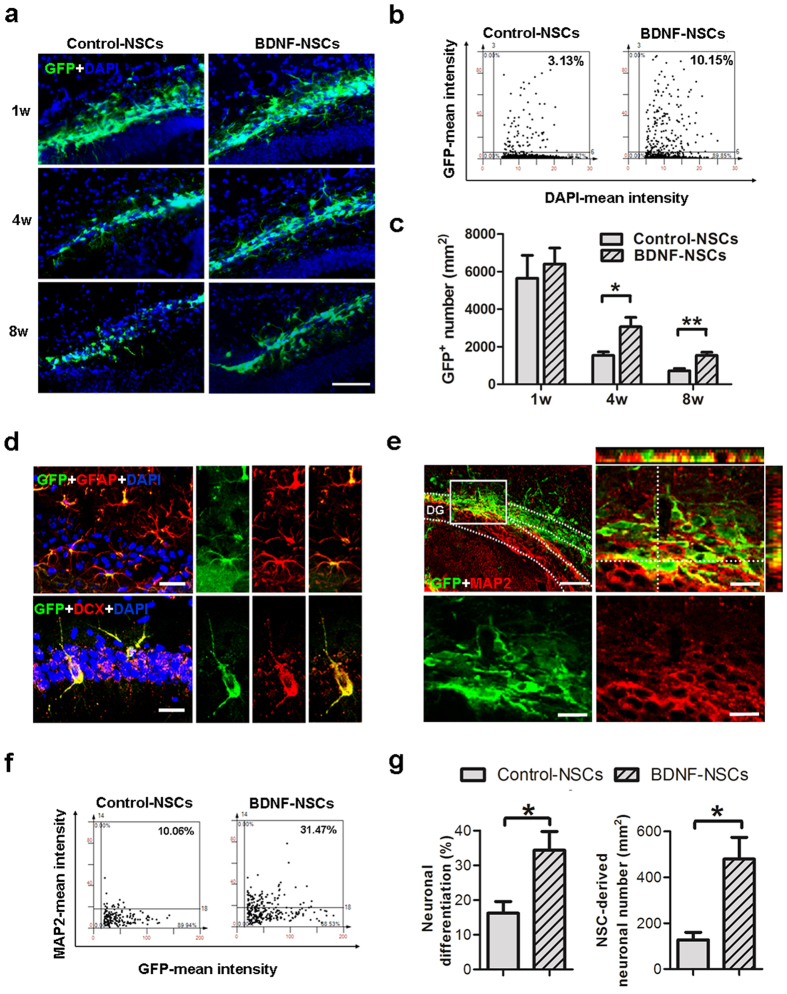
Figure 3. BDNF Overexpression Improves the Viability and Neuronal Fate of Engrafted NSCs.
(a) IF staining for engrafted GFP-expressing cells in the DG of AD mice at 1, 4, and 8 weeks after transplantation. Scale bar: 200 μm. (b) Representative dot plot of IF staining for GFP and DAPI from a flow cytometry-like analysis system (TissueFAXS and TissueQuest) at 8 weeks after NSC transplantation. (c) Accumulative mean GFP-expressing cell number at 1, 4, and 8 weeks after NSC transplantation (n = 6 per group at each time point; results represent the mean ± SEM; *p < 0.05 **p < 0.01 by unpaired Student’s t-tests). (d) IF staining for confocal microscopy indicates that engrafted GFP-expressing cells display DCX and GFAP at 4 weeks after transplantation, confirming their ability to differentiate into neural lineages. Scale bar: 20 μm. (e) IF staining of GFP and MAP2 for engrafted cells in the DG of AD mice at 8 weeks after transplantation. The dashed line encloses the granule cell layer (upper-left panel, bar: 100 μm). The blocked area is presented as an amplified orthogonal view (upper-right panel, bar: 20 μm). The immunoreactivities of GFP and MAP2 are presented in separate lower panels (Bar, 20 μm). (f) Representative dot plot of the IF staining for GFP and MAP2 at 8 weeks after NSC transplantation. (g) Accumulative mean ratio and number of GFP and MAP2 double-positive cells (n = 6 per group; results represent the mean ± SEM; *p < 0.05 by unpaired Student’s t-tests).

