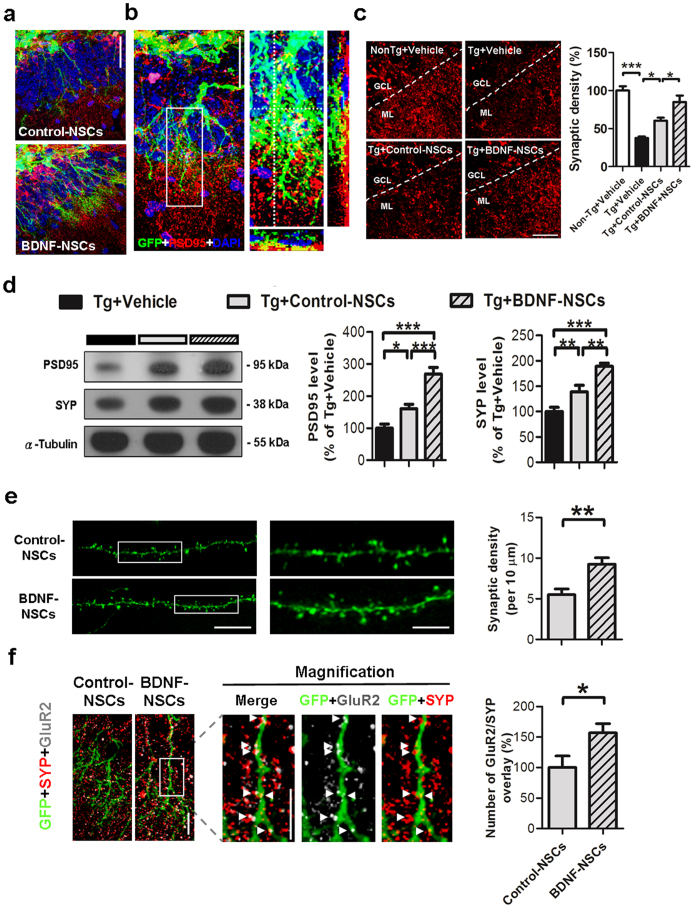
Figure 4. Engrafted NSC-derived Neurons Form Synapses and Ameliorate the Synaptic Loss in the Hippocampus of AD Mice.
(a) Representative figure of engrafted Control-NSC- and BDNF-NSC-derived neurons integrated into the granule cell layer. Scale bar: 50 μm. (b) Left, confocal microscopy z-stack analysis-based IF staining of GFP and PSD95 at 8 weeks after NSC transplantation. Scale bar: 50 μm. Right, the enclosed area is presented as an amplified view with orthogonal projection. (c) Left, IF staining of PSD95 in the hippocampal molecular layer at 8 weeks after NSC transplantation. Scale bar: 25 μm. Right, the synaptic density of each view was accumulated and quantified (n = 6 per group; results presented as the mean % ± SEM). (d) Representative western blot data and quantification results for the hippocampal level of PSD95 and SYP in AD mice (n = 6 per group; results presented as the mean % ± SEM). (e) Representative image of synaptic spines from Control-NSC- and BDNF-NSC-derived neurons. Bar, 15 μm. Magnified images at right side present the region of enclosed white square. Bar, 5 μm. Quantification of the synaptic spine density. (Control-NSCs n = 24 from 3 mice, BDNF-NSC n = 27 from 3 mice) (f) Representative image of IF staining for GluR2 and SYP on the two types of engrafted cell. Magnified images present the region of enclosed white square in the respective immunoreactivity from BDNF-NSC. Arrowheads point to the GluR2 and SYP overlays. Bar, 10 μm. (Control-NSCs n = 21 from 3 mice, BDNF-NSC n = 24 from 3 mice; data represented by BDNF-NSC; results presented as the mean % ± SEM). *p < 0.05, **p < 0.01, ***p < 0.001. (c,d) Statistical analyses by one-way ANOVAs with Tukey’s post hoc tests. (e,f) statistical analyses by unpaired-t test.

