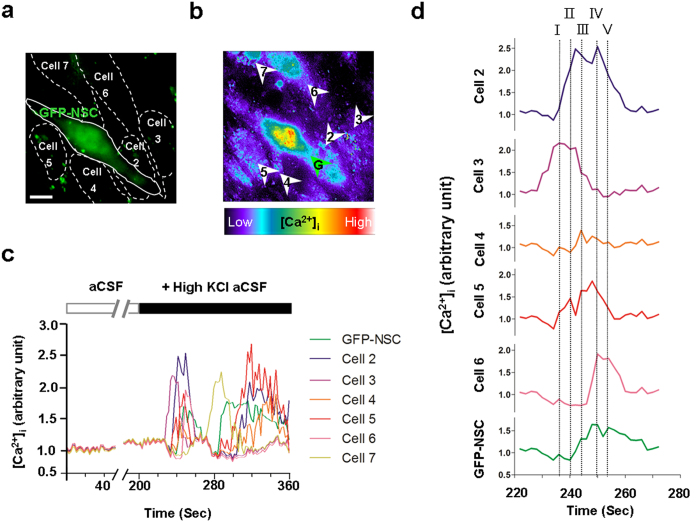
Figure 5. Engrafted Cells Integrate into the Ca2+-mediated Functional Network of Host.
(a) Illustration of the engrafted GFP expressing cells and the endogenous cell borders in the hippocampal DG. Bar, 10 μm. Data represented by BDNF-NSC. (b) Image of radiometric calcium orange: brighter color represents higher responses of calcium fluctuations. Arrowheads point to the quantified regions of interest in the measurements of calcium fluctuations. (c) [Ca2+]i fluctuation responses of engrafted cells (green) and endogenous cells (cell 2–7). High KCl triggered the rise in [Ca2+]i and induced temporary related oscillations in the engrafted cell and endogenous cells. (d) [Ca2+]i traces (220–270 seconds) are magnified in d. The chronologically overlapping events from the engrafted cell and neighboring cells are represented by dotted lines I-V.

