
Figure 6. Comparison of the foliar N content among different years and treatments.
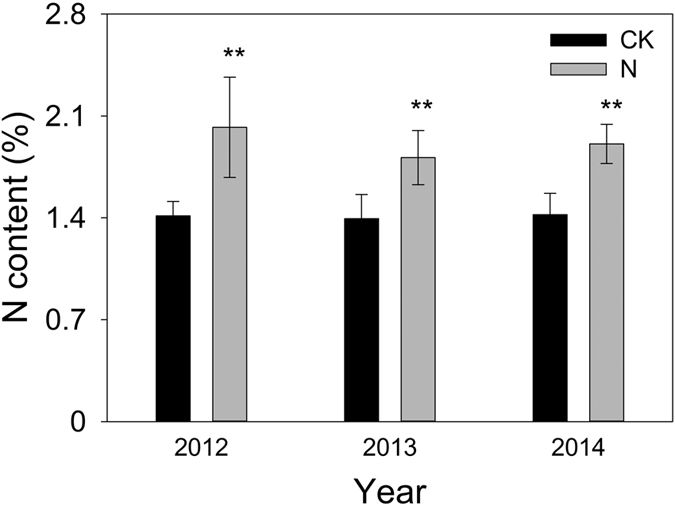
An asterisk above the error bars indicates a significant difference between treatments (p < 0.001). Values showed in the figure are averaged with standard errors from 8 plots of each treatment.