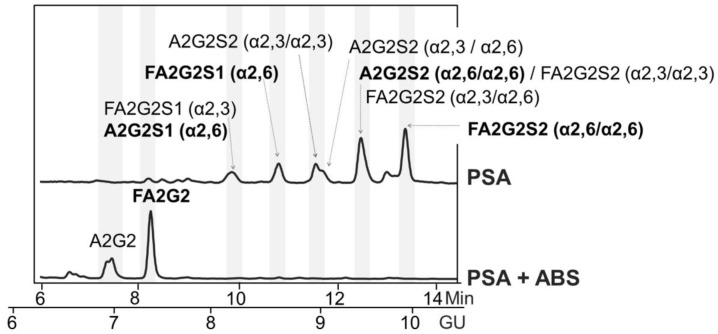
Figure 1.
Glycosylation analysis of standard (Std) PSA. HILIC-UPLC chromatograms of N-glycans released from the Std PSA. N-glycan profiles from the undigested sample (top) and after sialidase digestion with ABS (digests all sialic acids) (bottom). Profiles are standardized against a dextran hydrolysate (GU). N-glycans structures are abbreviated as follows: all N-glycans have two core N-Acetylglucosamines (GlcNAc) and a trimannosyl core; F at the start of the abbreviation indicates a core fucose; A represents the number of antenna; G represents the galactoses linked β1-4 on antenna; S represents the sialic acids linked to the galactose. In peaks containing more than one glycan structure 36, the major one is marked in bold.

