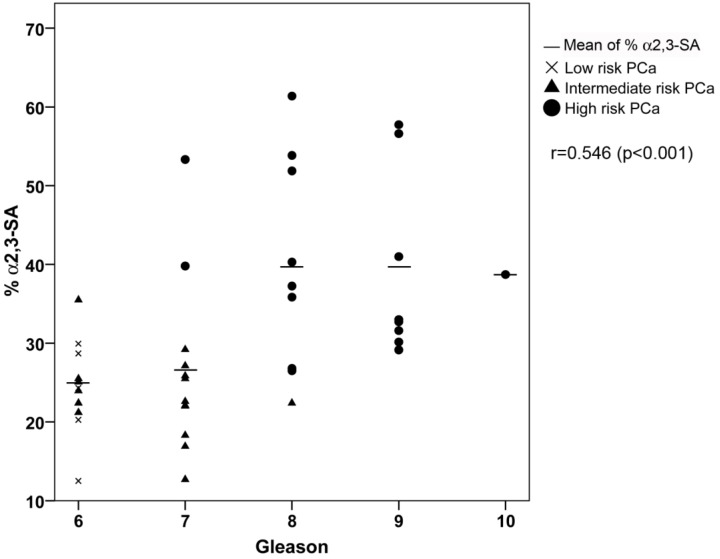
Figure 6.
Correlation plot of percentage of α2,3-sialic acid (%α2,3-SA) in PSA from the PCa serum samples with their Gleason score. Serum samples from low-risk PCa are indicated with a cross, intermediate-risk PCa with a black triangle and high-risk PCa with a black circle. The mean %α2,3-SA for each Gleason score is indicated with a horizontal line.

