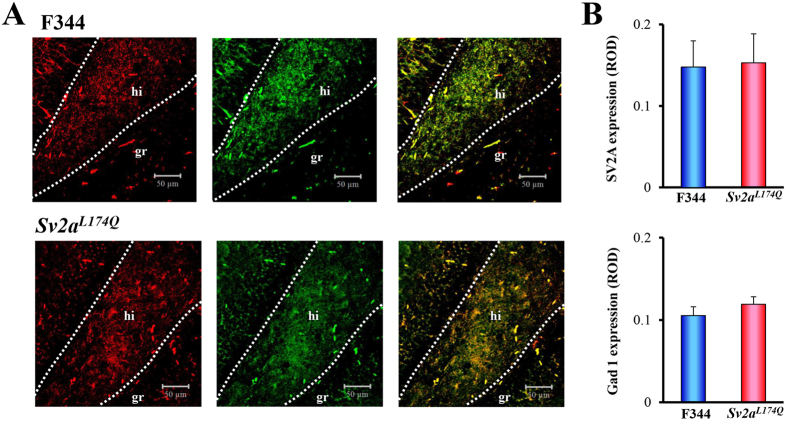
Figure 6. Double immunofluorescence staining of SV2A and Gad1 in the hippocampal dentate gyrus.
(A) Representative photos illustrating double immunofluorescence staining of Gad1 (left panel: red) and SV2A (center panel: green) in the hippocampal dentate region of F344 (upper panel) and Sv2aL174Q (lower panel) rats. The left panel represents a merged image of SV2A- and Gad1-immunoreactivity. hi: hilus, gr: granular cell layer. (B) Expressional levels of SV2A and Gad1 expression in the dentate hilus of Sv2aL174Q and F344 rats. ROD: relative optical density. Each column represents the mean ± S.E.M. of 4 animals.

