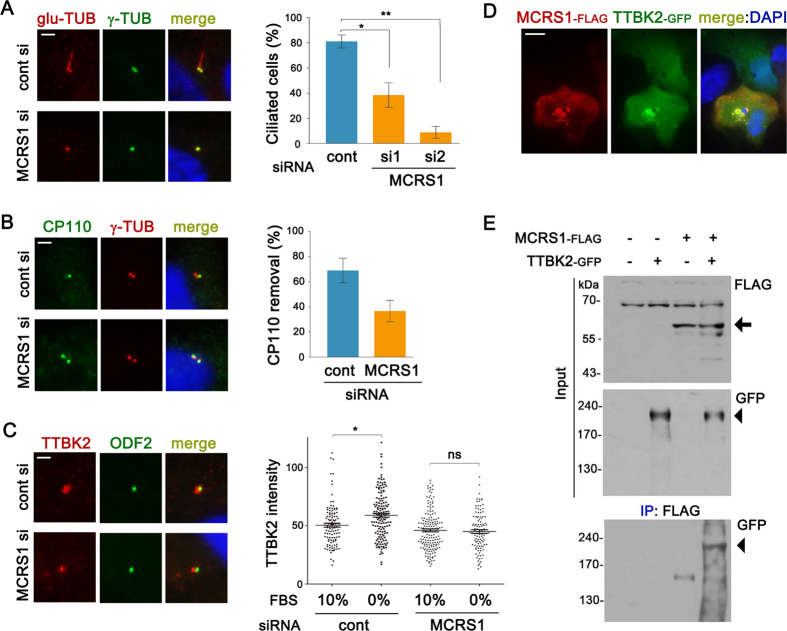
Figure 3. MCRS1 is required for ciliogenesis and TTBK2 recruitment to the mother centriole.
(A) RPE1 cells were transfected with siRNAs for 24 hr, and then serum-starved for 2 days. Cilia were stained with anti-polyglutamylated Tubulin antibody. The graph shows quantification of ciliated cells. Error bars represent SEM (n=3 independent experiments; *P < 0.05 and **P < 0.01, t test). (B) Immunofluorescence analysis of CP110 cap removal from the mother centriole. Cells were transfected with siRNAs for 48 hr, and then serum-starved for 24 hr. The graph shows quantification of cells with single CP110 dot in the centrosome. Error bars represent SEM (n=3 independent experiments). (C) Immunofluorescence analysis of TTBK2 recruitment to the mother centriole. Cells were transfected with siRNAs for 56 hr, and then serum-starved for 16 hr. The scatter plot shows quantification of immunofluorescence intensities of TTBK2 at the centrosomal area. Error bars represent SEM (more than 100 cells were examined for each group; *P < 0.05, t test). (D) Immunofluorescence images of a RPE1 cell expressing MCRS1-FLAG and TTBK2-GFP. (E) HEK293T cells were transfected with the indicated plasmids for 16 hr. Cell lysates were immunoprecipitated with anti-FLAG antibody conjugated with agarose beads. The resulting precipitates and input lysates were immunoblotted with the indicated antibodies. Arrow and arrowhead indicate bands at the molecular weight of MCRS1-FLAG and TTBK2-GFP, respectively. Scale bars represent 10 μm (A and D) and 2 μm (B and C).

