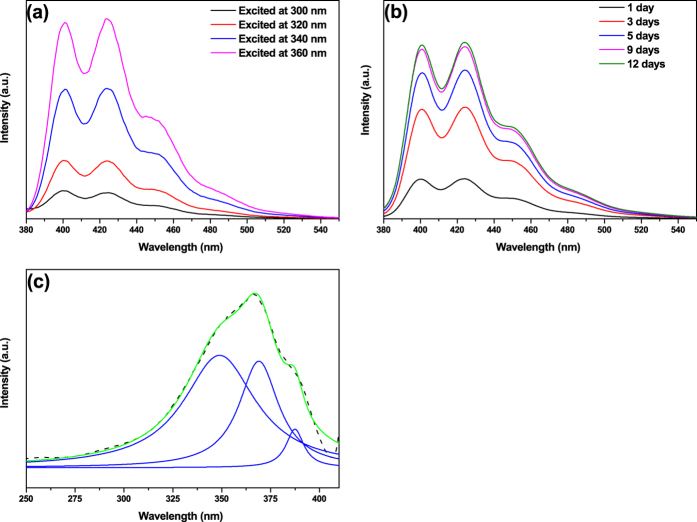
Figure 3.
(a) PL emission spectra of PQDs excited with varying wavelengths from 300 nm to 360 nm. (b) PL emission spectra of PQDs excited at 360 nm measured from 1st to 12th day. (c) The measured PL excitation spectrum of PQDs by monitoring the PL peak at 424 nm (dashed line), sum of Lorentzian fittings (green line), and three Lorentzian fittings (blue lines).

