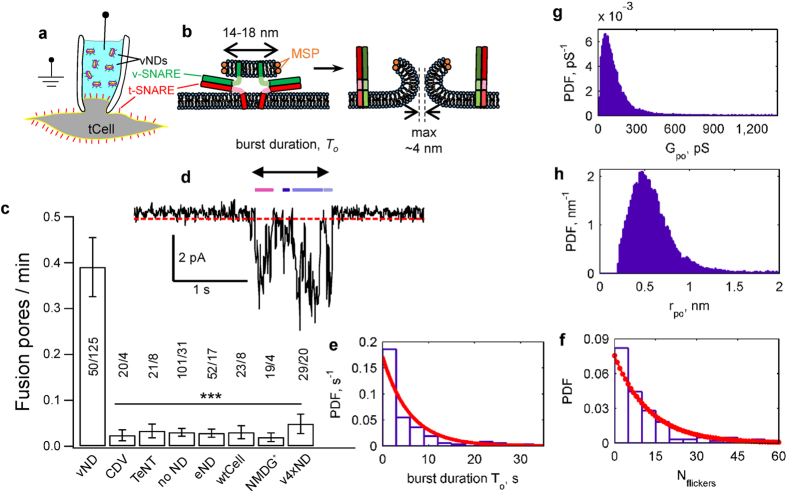
Figure 1. Detection of single fusion pores between v-SNARE nanodiscs (vNDs) and flipped t-SNARE cells (tCells).
(a,b) Schematic of the setup and vND-tCell fusion. A pipette is sealed onto the tCell to isolate a patch of membrane (a). Unlike fusion of a closed vesicle with a voltage-clamped membrane, vND-tCell fusion establishes a direct ionic conduction pathway between the cell cytosol and the pipette solution (b). The schematic in b is approximately to scale. (c) Fusion pores are SNARE-induced. When the soluble cytoplasmic domain of the v-SNARE VAMP2 (CDV), or the tetanus neurotoxin light chain (TeNT) was included in the pipette solution, currents occurred much less frequently. Similarly, not including NDs in the pipette (no ND), using SNARE-free, empty NDs (eND), wild-type cells not expressing flipped t-SNAREs (wtCell), replacing Na+ with the larger NMDG+, or replacing wild-type VAMP2 with a mutant that was previously shown to induce docking but not fusion largely abolished currents. (***Indicates p < 0.001, t-test against vND-tCell). The number of patches/pores for each condition is indicated. (d) Example of a fusion pore current “burst”. Open sub-states are defined as having current <−0.25 pA (red dashed line) for at least 60 ms. Colored bars above the fusion pore indicate detected open periods. (e) Distribution of burst lifetimes, To, as defined in (d). The red, solid line is an exponential fit, with mean 5.8 s. (f ) Distribution of flicker numbers  , and fitted geometric distribution (red solid line, y = p(1 − p)n, n = 0, 1, 2, 3, …
 with p = 0.754 ± 0.0129 (95% confidence interval). (g) Probability density function of open-pore conductances, Gpo, averaged over 122 individual fusion pores from 50 cells. (h) Probability density function for open-pore radii. For (e–h), the mean ± S.E.M. were To = 5.8 ± 0.9 s, Nflicker = 12 ± 2, Gpo = 152 ± 12 pS, and rpo = 0.60 ± 0.02 nm.

