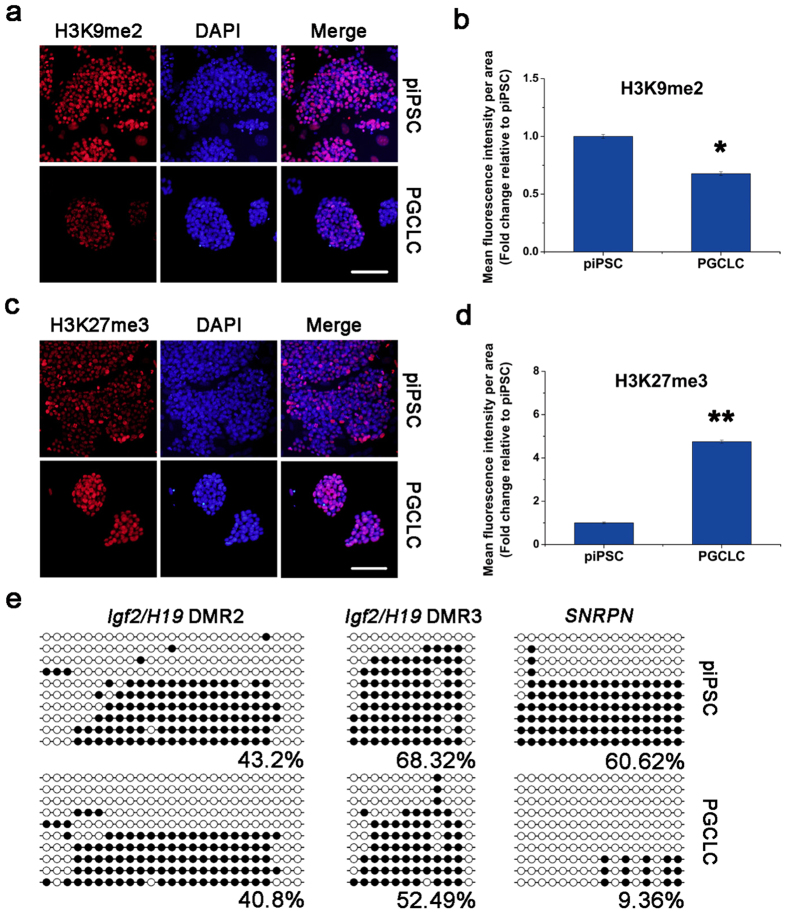
Figure 3. Epigenetic properties of the PGCLCs.
(a,c) Immunofluorescence analyses of H3K9me2 (a) and H3K27me3 (c) in PGCLCs under the induction system. Nuclei were stained with DAPI (Blue). Scale bar, 100 μm. (b,d) Quantification of relative H3K9me2 (b) and H3K27me3 (d) fluorescence intensity using ImageJ software. Fluorescence in iPSCs is as a standard. *p ≤ 0.05; **p ≤ 0.001. (e) Bisulfite sequence analysis of DMRs of paternally and maternally imprinted genes in iPSCs (top) and the PGCLCs (bottom). White and black circles represent unmethylated and methylated CpGs sequences, respectively.

