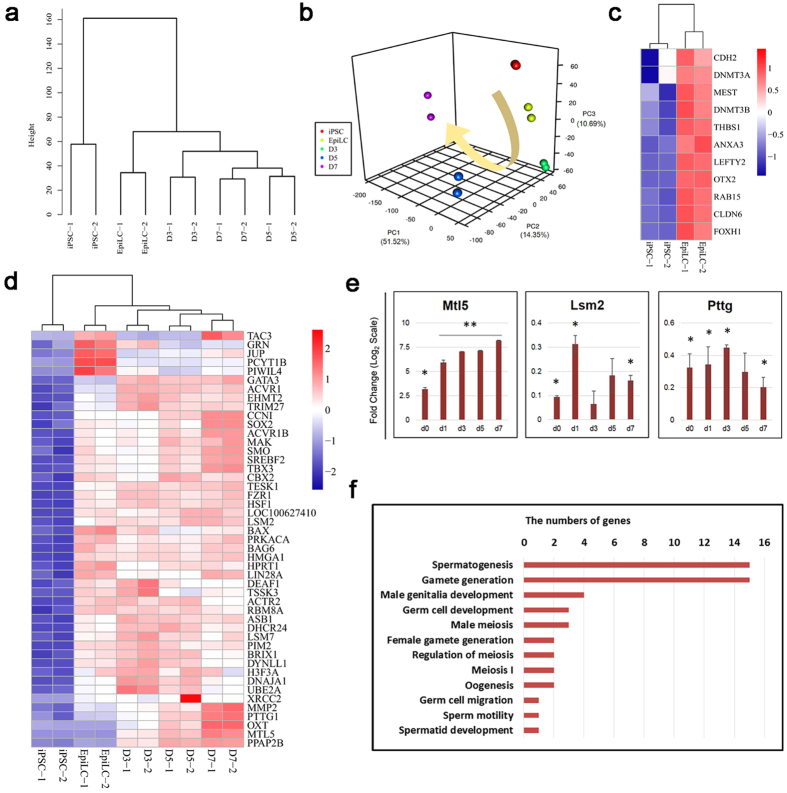
Figure 4. Transcriptional profiles during PGCLC induction.
(a) Unsupervised hierarchical clustering (UHC) of gene expression in iPSCs, EpiLCs and PGCLCs. (b) PCA of RNA-seq data. Arrowline indicates potential progression from iPSCs to PGCLCs. (c) Heatmap of the expression of marker genes of epiblast stem cells in iPSCs and EpiLCs. (d) Heatmap of the expression of selected genes associated with germ cell development. (e) Quantitative RT-PCR analyzed the expression of genes selected by heatmap. The piPSCs were used as the control. The d0, d1, d3, d5 and d7 are short for the day 0, day 1, day 3, day 5 and day 7 during induction of PGCLCs from EpiLCs, respectively. Error bars indicate SDs from two independent experiments. *0.001 ≤ p ≤ 0.05; **p < 0.001. (f) GO terms associated with germ cell developement of upregulated porcine day 7 PGCLCs compared with iPSCs.

