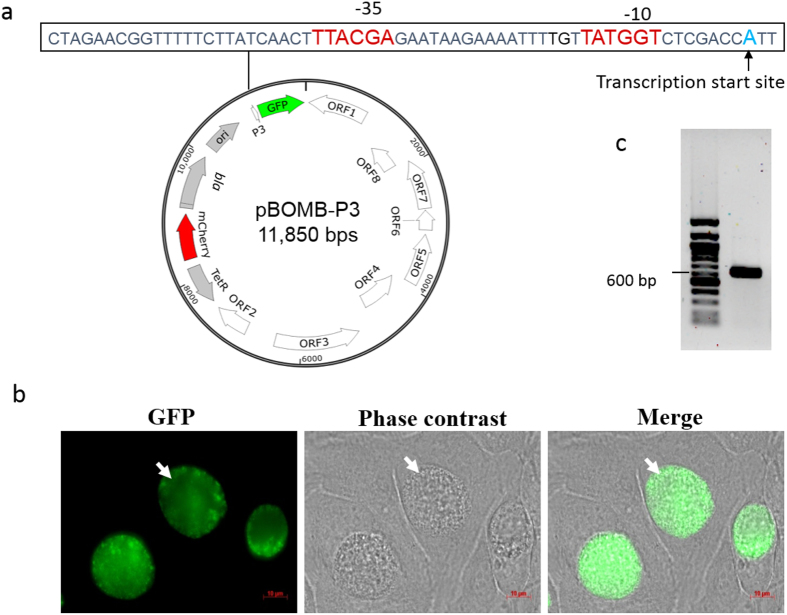
Figure 3. Determining P3 activity in C. trachomatis.
(a) Map of pBOMB-P3. Sequences of P3 region are indicated. (b) Appearance of living L2/pBOMB-P3 infected HeLa cells at 30 h pi. GFP-expressing inclusions are marked with white arrows. (c) The ompA P3 transcriptional start site (TSS) was identified by 5′-RACE assays. The PCR products next to the DNA ladder on the agarose gel were subjected to sequencing, and the TSS of P3 appears to be “A” (in blue font), marked with an arrow. The putative −35 and −10 hexamers are indicated in red font.

