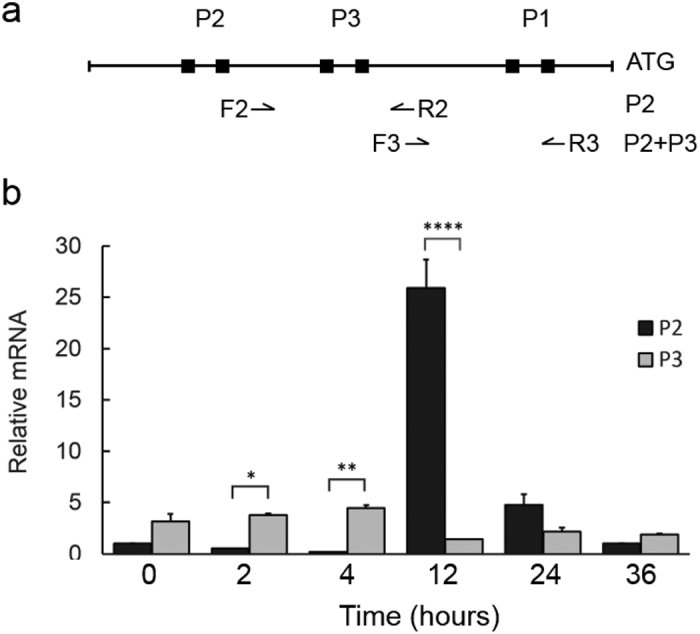
Figure 5. The profile of ompA P3 and P2 expression in chromosomal loci.

(a) Diagram showing the location of primers designed to assess ompA transcripts by RT-qPCR. Amplification with the primers, F2/R2, produces P2 transcript, whereas amplification with primers, F3/R3, generates the total transcripts of P2 and P3. The individual P3 transcript is obtained by subtracting P2 transcript from both P3 and P2 transcripts. (b) Results of RT-qPCR with total RNA from L2/434/Bu infected HeLa cells harvested at 0, 2, 4, 12, 24, and 36 h pi. Relative amounts of transcript were obtained by normalizing the levels of P2 or P3 transcript to C. trachomatis genomic DNA levels, which were assessed using primers specific to the 16S rRNA gene (Table S3). The values are presented as mean ± SD from an experiment with duplicates. *P < 0.05, **P < 0.005, and ****P < 0.0001. Three independent experiments were performed.
