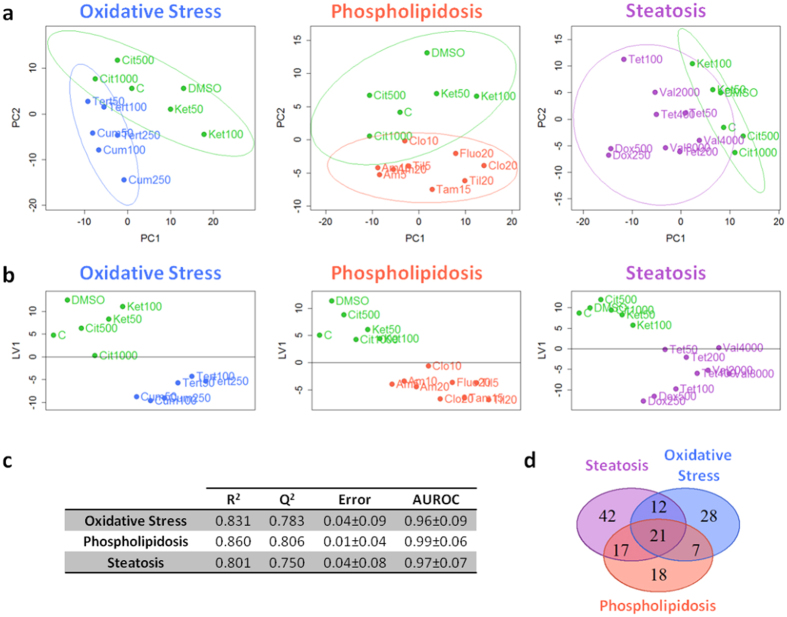
Figure 2. Multivariate data analysis of the metabolomic changes induced by each mechanism of hepatotoxicity.
PCA (a) and PLS-DA (b) scores plots corresponding to pairwise comparisons (i.e. control vs. each mechanism of hepatotoxicity) of the data obtained from HepG2 cells treated with hepatotoxins acting through different mechanisms. Each point summarizes all the information provided by the four different analytical conditions (272 identified metabolites). The lines denote 95% confidence interval Hotelling’s ellipses. PCA models were developed using two principal components. PLS-DA models were built using one latent variable. (c) Figures of merit of the PLS-DA models. Misclassification error and AUROC are expressed as mean ± standard deviation. (d) Venn diagram showing the overlap among the metabolites altered by the model compounds representative of different toxicity mechanisms. Green: control; blue: oxidative stress; red: phospholipidosis; purple: steatosis. Abbreviations corresponding to drug names and concentrations are depicted in Table 1, C corresponds to control culture and DMSO to control culture with DMSO at 0.5% (v/v).

