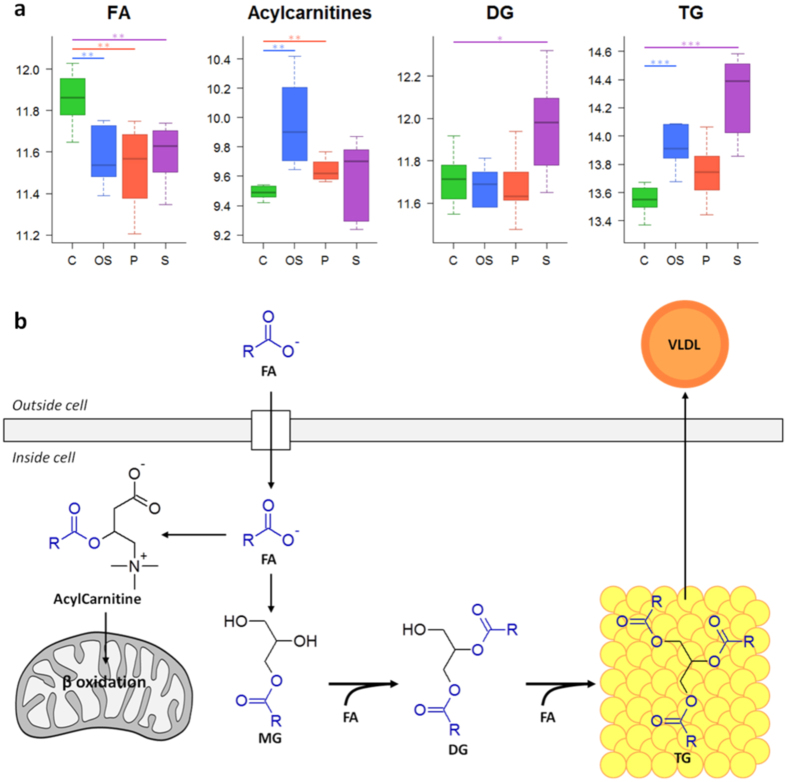
Figure 5. Metabolic alterations related to fatty acids and triacylglycerides metabolism.
(a) Boxplots showing the altered metabolites. Boxes denote interquartile ranges, lines denote medians and whiskers denote 10th and 90th percentiles. Metabolite relative abundance, expressed as ratio or log-transformed, is calculated by referring metabolite peak intensity to a constant concentration of internal standard per mg of tissue. Green: control (C); blue: oxidative stress (OS); red: phospholipidosis (P); purple: steatosis (S). *, q value < 0.05; **, q value < 0.01; ***, q value < 0.001 calculated using the Mann Whitney test corrected for multiple testing by using FDR. (b) Fatty acids and triacylglycerides metabolism in the liver. DG: diacylglyceride; FA: fatty acid; MG: monoacylglyceride; TG: triacylglyceride; VLDL: very low-density lioprotein.

