
Figure 6. Overview of the PLS-DA model aimed at the discrimination among the different mechanisms of hepatotoxicity.
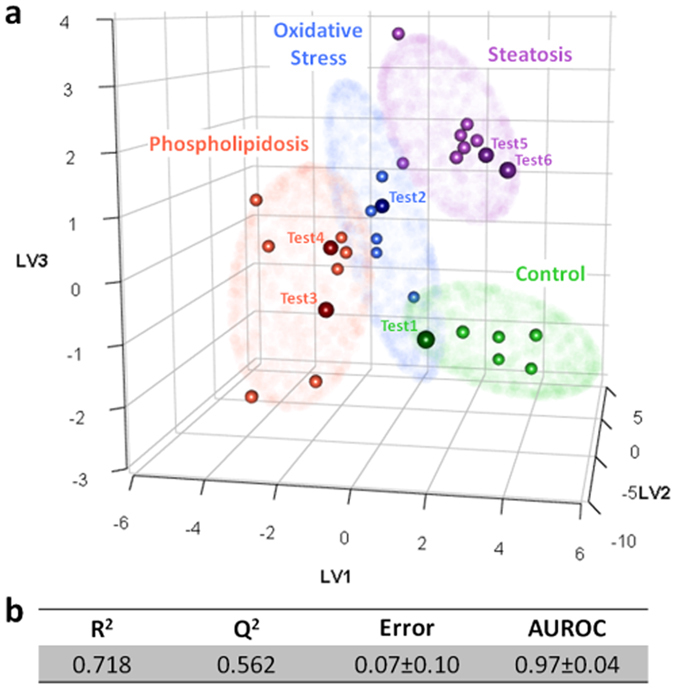
The PLS-DA model was built using three latent variables and the top- 26 ranked variables based on the model development subset with data obtained from the metabolomic analysis of HepG2 treated with either non-toxic or hepatotoxic compounds acting through different mechanism of hepatotoxicity (i.e. oxidative stress, phospholipidosis and steatosis). (a) Scores plot. The lines denote 95% confidence interval Hotelling’s ellipses for each class. Green: non-toxic; blue: oxidative stress; red: phospholipidosis; purple; steatosis. Small spheres correspond to samples used to develop the model. Larger spheres correspond to the PLS-DA projection of the external validation samples, denoted as test samples and colored based on their predicted class. (b) Figures of merit of the PLS-DA model.