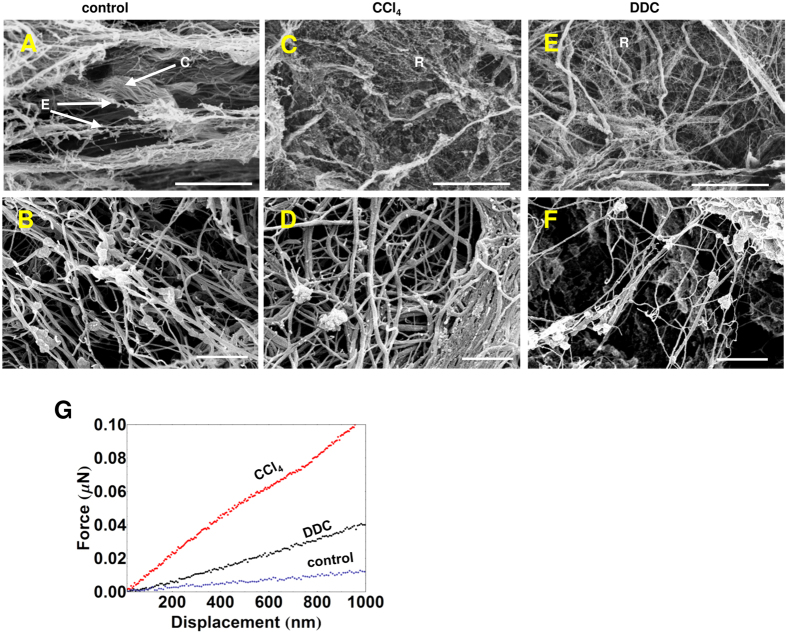
Figure 3. Alterations in the microstructure of damaged livers.
SEM images of control (A,B), CCl4- (C,D) and DDC-treated (E,F) decellularized livers. E-elastic fibers, C-collagen fibers and R-reticular fibers. Scale bars: 10 μm (top panels), 500 nm (bottom panels), n = 3. (G) The average force-displacement curves of decellularized liver matrices. The median elastic stiffness for control, CCl4- and DDC-treated livers: 0.18 ± 0.02 MPa, 0.9 ± 0.3 MPa and0.35 ± 0.03 MPa, respectively.

