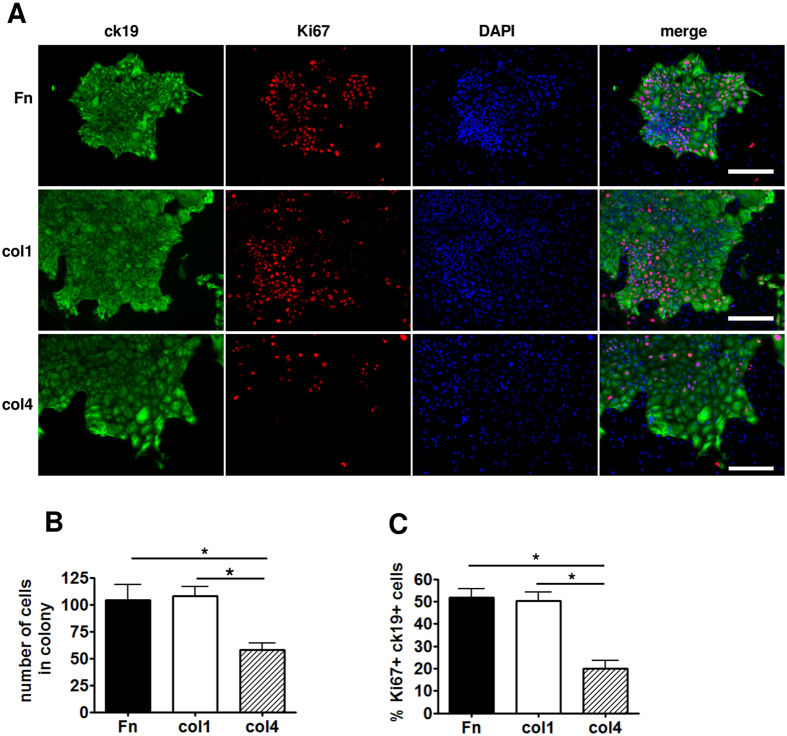
Figure 4. Non-hepatocyte cell growth assay on dishes coated with fibronectin (Fn), col1 or col4.
(A) Colonies stained with anti-ck19 and -Ki67 antibodies. Scale bars: 200 μm. (B) Statistical analysis of the average number of cells in a colony on differently coated plates. (C) Percentage of proliferating ck19 + cells. Bars show the average of 3 independent experiments ± SD. Two-way ANOVA tests were used to assess differences between groups, *indicates a statistically significant (P < 0.01) difference.

