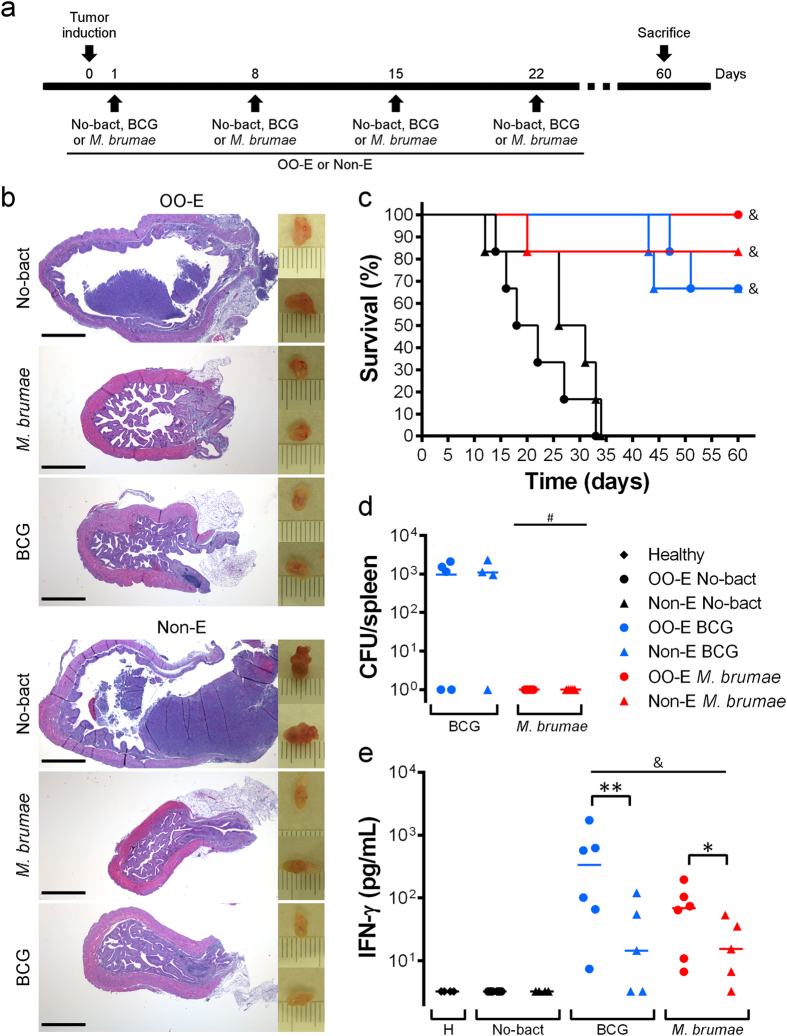
Figure 7. In vivo treatment with OO-emulsified mycobacteria.
(a) Schematic schedule of the induction of the tumor and treatments. C57BL/6 mice (n = 6) received four weekly intravesical instillations (indicated by arrows) of only the vehicle: emulsion alone (No-bact OO-E) or PBS (No-bact Non-E) or mycobacteria in emulsion (OO-E) or in PBS (Non-E), after tumor implantation. (b) On the right, macroscopic pictures taken from representative bladders of tumor-bearing mice after receiving the different treatments. Each mark is 1 mm. On the left, histological images (hematoxylin-eosin staining) of bladder sections from the same bladders. Scale bar, 1 mm. (c) Kaplan-Meier curve of survival in tumor-bearing mice after treatments. &p < 0.05 versus respective no mycobacteria groups (Log-Rank Mantel-Cox tests). (d) Colony-forming units (CFU) of splenocytes cultures from treated mice. The means of three replicates of the viable bacteria from each spleen is represented as a dot; the line identifies the mean of the animal group. #p < 0.05 versus respective BCG groups (Mann-Whitney U test). (e) Production of IFN-γ by mycobacteria-stimulated splenocytes from treated mice measured 72 hours after stimulation. Dots represent the means of two technical replicates per spleen; the line identifies the mean of the animal group. &p < 0.05 versus PBS group; *p < 0.05; **p < 0.01 (Mann-Whitney U test).

