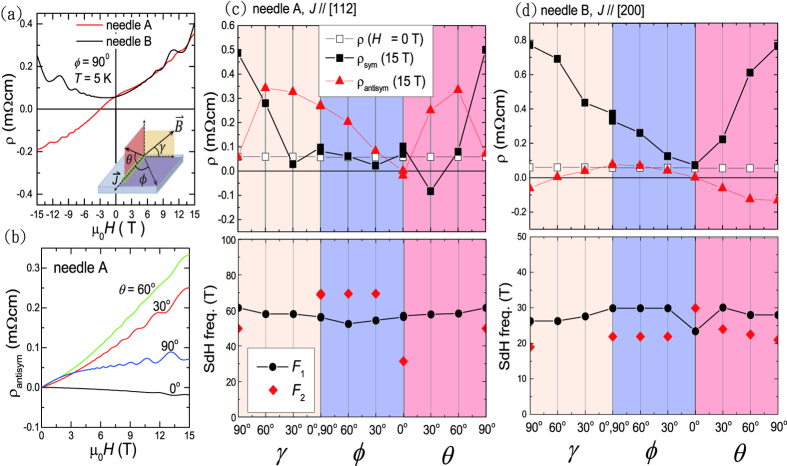
Figure 3.
(a) Resistivity ρ versus field μ0H shows significant antisymmetric component in needle A and B. The lower inset cartoon illustrates the geometric definition for angles of γ, ϕ, and θ. (b) Extracted antisymmetric components (ρantisym) in MR of needle A at four different θ angles. At μ0H = 15 Tesla, the angular dependence of extracted symmetric (ρsym) and antisymmetric (ρantisym) components of needle A and B are shown in (c,d), respectively. The lower panel shows the corresponding SdH frequencies that can be identified from the FFT spectra. The major SdH frequencies F1 (black circles) at about 61 Tesla and 27 Tesla for needle A and B, respectively, both show weak angular dependence. Secondary SdH frequencies F2 appear at some angles shown as red diamonds.

