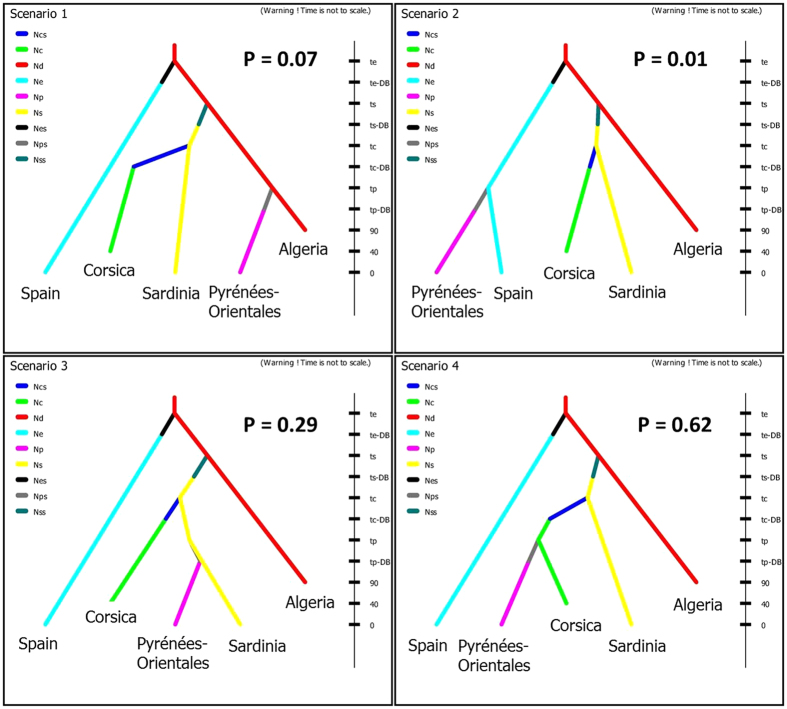
Figure 6. Graphical representation of the tested scenarios regarding colonization sources of C. imicola in the Pyrénées-Orientales.
Microsatellite data were used and data were simulated using an approximate Bayesian computation (ABC) approach. The y-axis represents the time of events (not to scale), time 0 being the most recent sampling date. Nc, Ns, Nd, Ne and Np refer respectively to the effective population sizes, stable over the time, of the populations from Corsica, Sardinia, Algeria, Catalonia and Pyrénées-Orientales and Ncs, Nss, Nes and Nps refer to the effective number founder for Corsica, Sardinia, Catalonia and Pyrénées-Orientales populations. P refers to the probability obtained for each scenario. Details of all scenarios and parameters are shown in Supplementary Tables 5 and 6.

