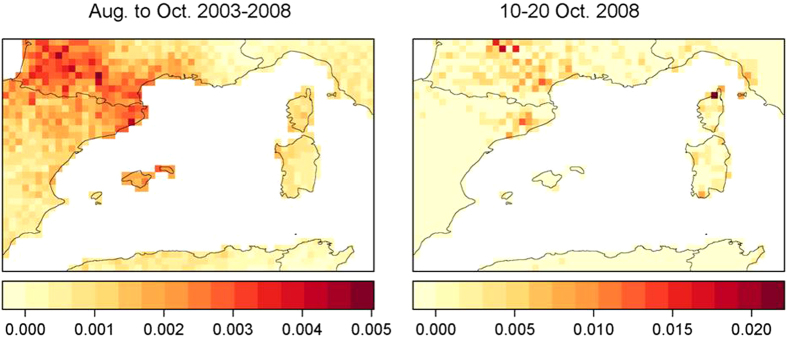
Figure 7. Source of winds potentially transporting C. imicola to the trap location in Pyrénées-Orientales.
To generate this map, the NAME dispersion model was run in backwards mode for 36H each day from 1 August to 31 October for the period 2003 to 2008, using 30,000 particles (left panel). We also present the results of the simulations for the period 10–20 Oct. 2008 only (right panel). The probability of pixels as source points for Pyrénées-Orientales was calculated as the total number of particles received in each pixel from the individual daily simulations divided by the total particles received by all the grid cells not located over the sea for each time period. Maps were generated using R software v3.2.2.

