
Figure 1.
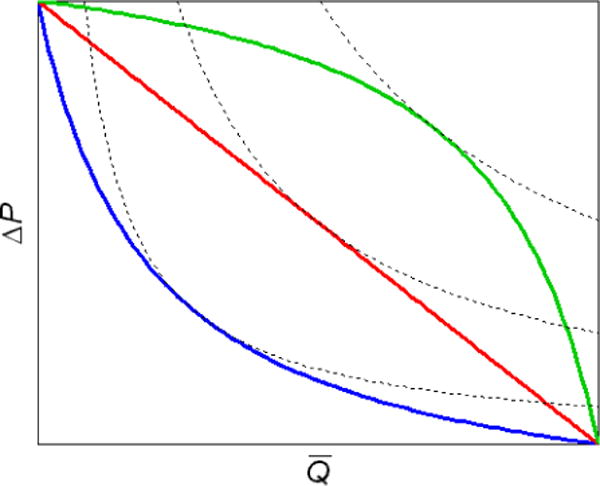
Three theoretically possible shapes for a pump-function curve, each describing a different pump. Also shown are curves of constant power (the product of Ǭ and ΔP) which are tangent to the three pump-function curves at their respective points of maximum power. The maximum power increases from blue to red to green, although all three pumps work within the same limits of maximum Ǭ and ΔP.