
Figure 2.
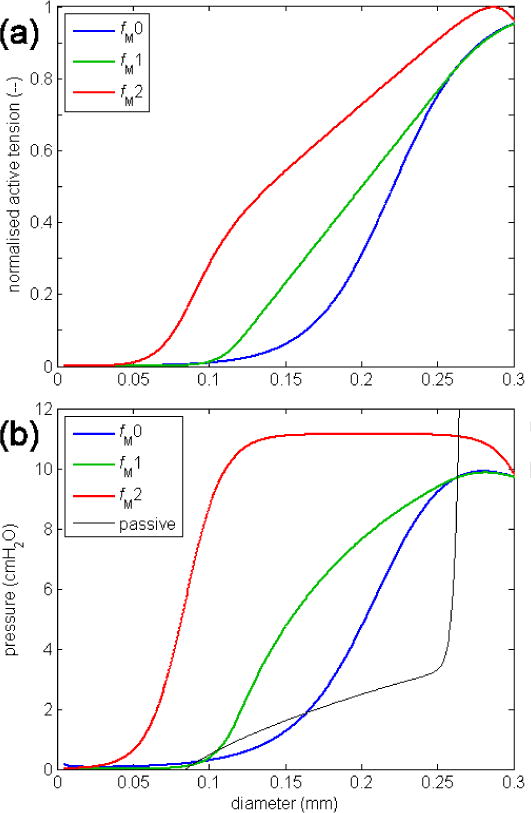
The three proposed forms for the variation of active tension with lymphangion diameter. (a) Normalised active tension, Md(D)/M0. (b) Active tension converted to its equivalent in transmural pressure contribution as 2Md(D)/D, for peak active tension M0 = 150 dyn/cm. It can thereby be directly compared with the passive Δptm−D relation (thin black curve) fitted to the data of Davis et al. [6]. The fM0 relation (shown in blue) was previously used [8] with M0 = 250 dyn/cm. The red curve has a higher maximum because the underlying normalised active tension peaks at a lower diameter.