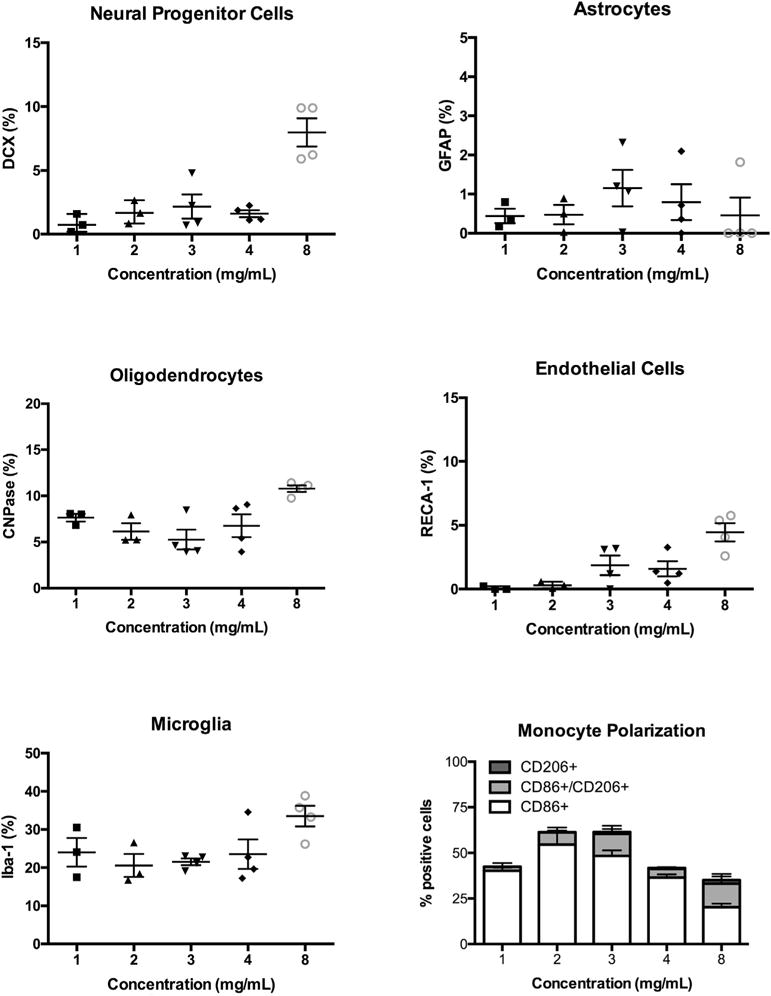
Fig. 10. Cell invasion – Quantification of cell phenotypes.

An 8 mg/mL ECM concentration resulted in the most significant proportion of brain cells invading the material. Most significantly neural (DCX+ cells) and oligodendrocyte progenitors (CNPase+ cells) were among the first phenotypes to invade the ECM, with astrocytes (GFAP+ cells) and endothelial (RECA-1+) cells being most negligible proportions. Nevertheless, as expected a high proportion of microglia (IBa-1+ cells) and macrophages invaded the material. Again, an 8 mg/mL ECM concentration produced the most significant shift from a M1 (CD86+ cells) towards an M2 (CD206+ cells) phenotype.
