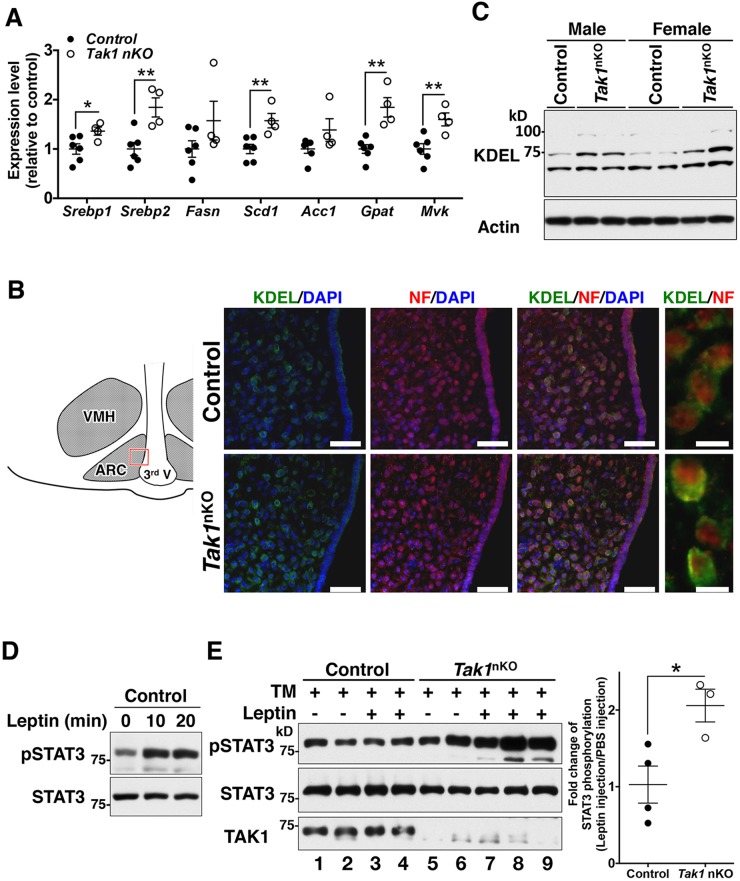
Fig. 4.
CNS-specific deletion of Tak1 protects mice from ER-stress-induced leptin resistance. (A) mRNA levels of SREBP-target genes in control (Tak1flox/flox no-Cre and Tak1flox/+ Nestin-Cre) and Tak1nKO hypothalamus from 8-week-old mice were analyzed by performing quantitative real-time PCR. All mRNA levels were quantified relative to Gapdh gene expression and presented as fold change relative to levels in control mice. Control, n=6; Tak1nKO, n=4; mean±s.e.m.; *P<0.05; **P<0.01. (B) The arcuate nucleus (ARC) of the hypothalamic sections from 8-week-old control and Tak1nKO male mice were analyzed by immunofluorescence staining with anti-KDEL (green) and anti-neurofilament-200 (red, NF) antibodies, and DAPI (blue). The schematic diagram indicates the region of ARC shown in the pictures. VMH, ventromedial hypothalamic nucleus; 3rd V, the third ventricle. Scale bars: 50 μm (left three panels); 10 μm (far-right panels). (C) The hypothalamic extract from 16-week-old control and Tak1nKO male (left three lanes) and female (right four lanes) mice fed a HFD for 12 weeks were analyzed by immunoblotting with an anti-KDEL-motif antibody. Each lane represents an individual mouse. (D) Intraperitoneal injection of leptin induces STAT3 phosphorylation (pSTAT3) in the hypothalamus. 16-week-old control mice that had been fed a normal diet were fasted for 18 h. PBS or 1 μg of leptin per gram of body weight was injected intraperitoneally, and the hypothalamus was isolated at the indicated time points after injection. STAT3 phosphorylation was analyzed by immunoblotting. (E) 8-week-old control and Tak1nKO mice (fed a normal diet) were fasted for 12 h. 20 μg of tunicamycin was injected by intracerebroventricular injection. After 6 h, vehicle (PBS) or 1 μg of leptin per gram of body weight was injected intraperitoneally, and hypothalamic STAT3 phosphorylation at 15 min post injection was analyzed by immunoblotting. Total amounts of STAT3 and TAK1 proteins are also shown. Each lane represents an individual mouse. The graph (at right) shows the quantification of the intensities of phosphorylated STAT3 normalized to total the intensity of STAT3, including data from additional samples not shown in the immunoblot. Control, n=4; Tak1nKO, n=3; mean±s.e.m.; *P<0.05; mean±s.e.m.

