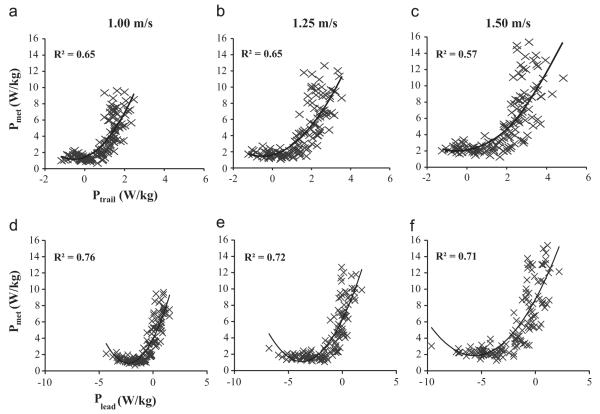
Fig. 3.
Relationship between metabolic power (Pmet) and mechanical power of the individual legs during the step-to-step transition phase. For both the trailing leg (Ptrail) (A–C) and leading leg (Plead) (D–F), data are presented for all slopes for all subjects at each velocity tested. We found that a quadratic model best described the correlation between Pmet and Ptrail for all three velocities (R2=0.57 to 0.65) and the correlation between Pmet and Plead for all three velocities (R2=0.71 to 0.76).

