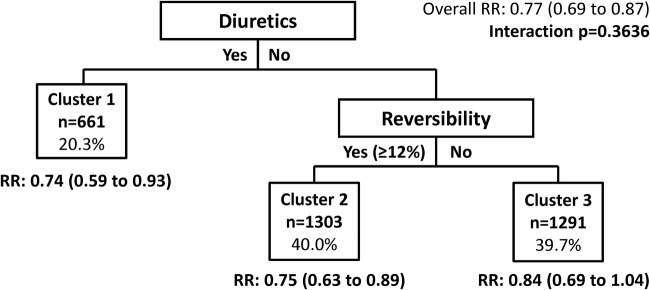
Figure 3.
Validation test of clusters maximising treatment differences based on the SAL/fluticasone combination cluster analysis model (total fluticasone furoate/vilanterol trial population). The model adjusted for baseline forced expiratory volume in 1 s % predicted, reversibility status (yes/no for ≥12% improvement and ≥200 mL) and investigator region as a random effect. Numbers in parentheses are 95% CIs. RR, rate ratio.

