Figure 3.
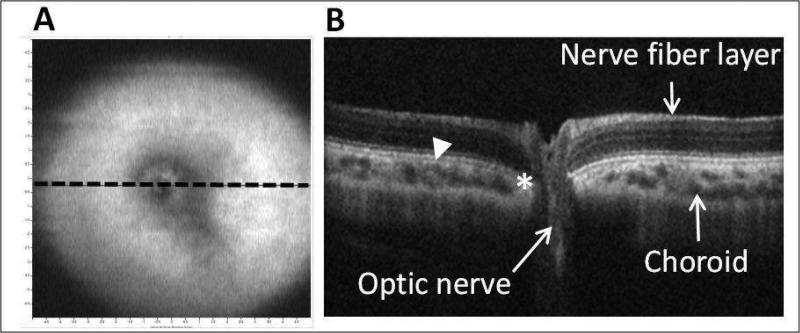
In vivo SD-OCT images from a 2 month-old pigmented guinea pig: A) low resolution en face volume intensity projection, indicating location of cross-sectional image in B (dotted line); and B) corresponding OCT image through optic nerve head (14 mm line scan, arrowhead: chorioretinal border; asterisk: termination of Bruch's membrane).

