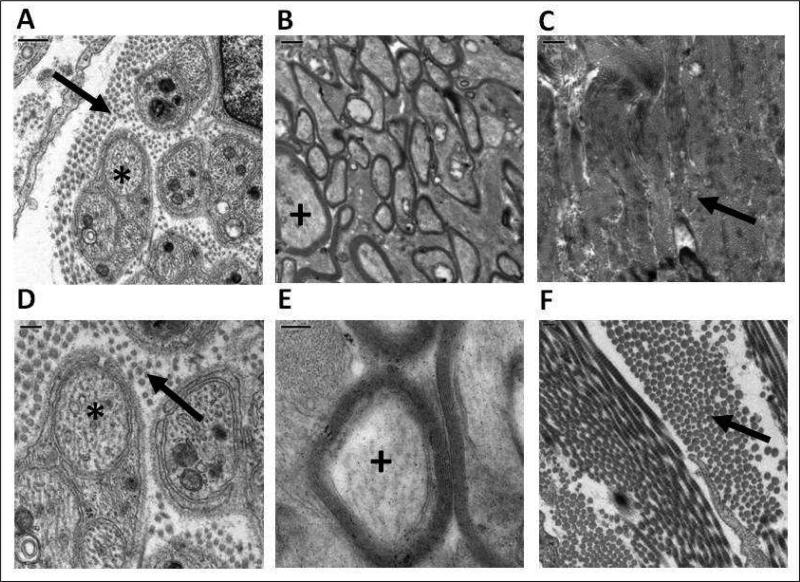
Figure 6.
TEM images of the optic nerve from the pre-laminar region (A & D; scale bars represent 0.5 & 0.2 μm respectively), and post-laminar region (B & E; scale bars represent 1 & 0.2 μm, respectively), as well as peripapillary sclera (C & F; scale bars represent 1 & 0.2 μm, respectively); * non-myelinated nerve fiber bundles; + myelinated nerve bundles; arrows identify collagen fibrils.

