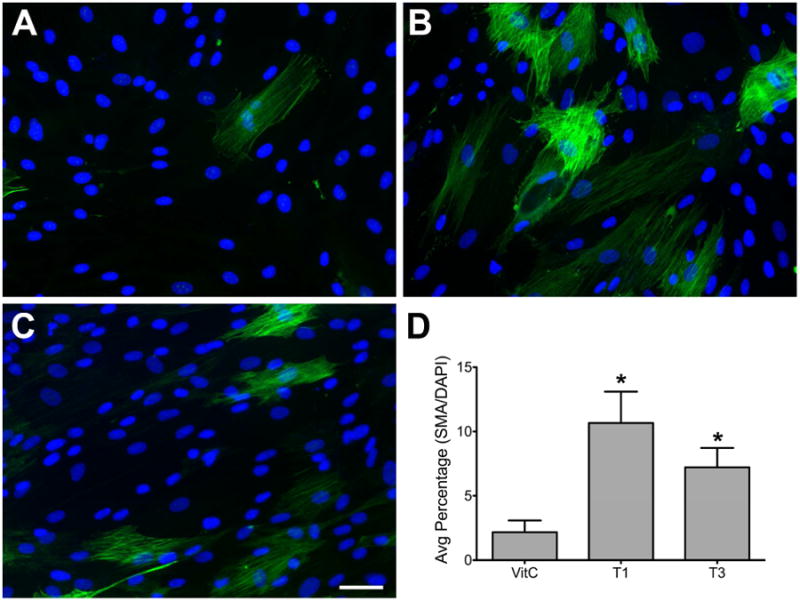
Figure 1. Indirect-immunofluorescent analysis of α-smooth muscle actin (SMA) in human corneal fibroblasts (HCF) ± TGF-β1 (T1) or TGF-β3 (T3).

Representative indirect-imuunofluorescent images show that in Control (VitC) samples (A), there are only a few SMA-positive cells present; however, with the addition of T1 (B), the number of SMA-positive cells increased significantly (D: *p<0.05) as compared with control (A and D). T3-stimulated cells (C) also showed a significant increase of SMA-positive cells (D: *p<0.05) as compared with control (A and D), however, to a lesser extent than T1 (B and D).
