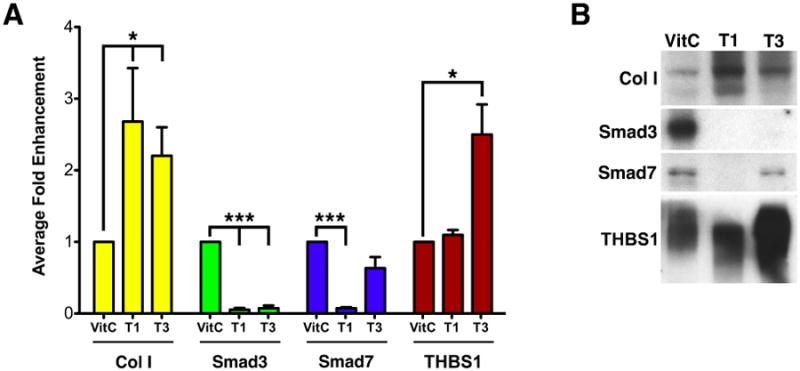
Figure 2. Western blot analysis of selected genes.

Selected genes of interest (type I collagen [Col I], Smad3, Smad7, and thrombospondin-1 [THBS1]) were examined by western blot to determine if the protein reflected the changes seen in the qRT-PCR data at 3 days. (A) Graph showing Average Fold Enhancement of samples treated either with Vitamin C only (Control, VitC), TGF-β1 (T1) or TGF-β3 (T3). (*P<0.05 and ***P<0.001) (B) Representative western blots for the data presented in (A).
