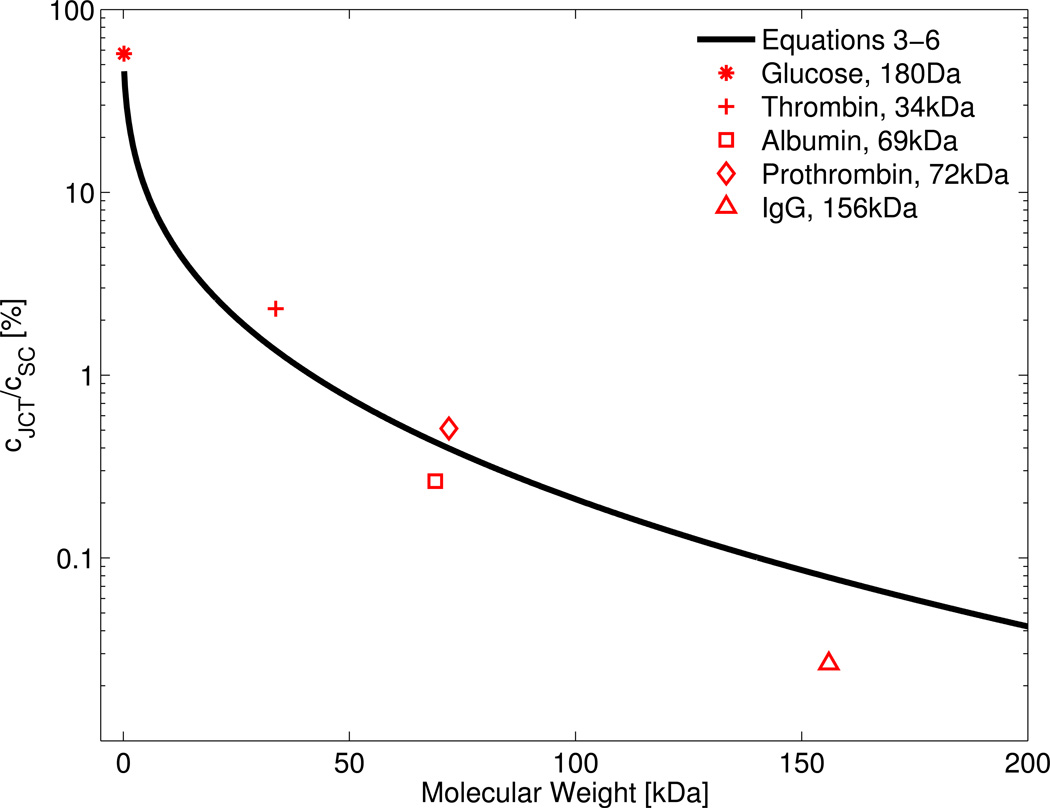
Figure 2.
The predicted relationship between the solute concentration ratio across a pore versus the molecular weight of the diffusing solute, as determined by combining Equations 3–6 (black curve). Red points show the ratio using the experimentally-determined values for the diffusion coefficient for glucose, thrombin (bovine), albumin, prothrombin (bovine) and γG-immunoglobulin (IgG), values of which were obtained from Harmison et al., 1961, Lamy and Waugh, 1953, Levick and Smaje, 1987 and Tyn and Gusek, 1990. Deviations from the curve are due to differences between the estimate provided by Equation 5 and the true diffusion coefficient. For solutes smaller than 10 kDa, the ratio is 10% or more, while for larger proteins, such as albumin, prothrombin and IgG, the ratio is 1% or less. This suggests that SC endothelium forms an effective barrier against retrograde transport of large molecular weight solutes and serum proteins into the JCT, consistent with its role as part of the BAB.

