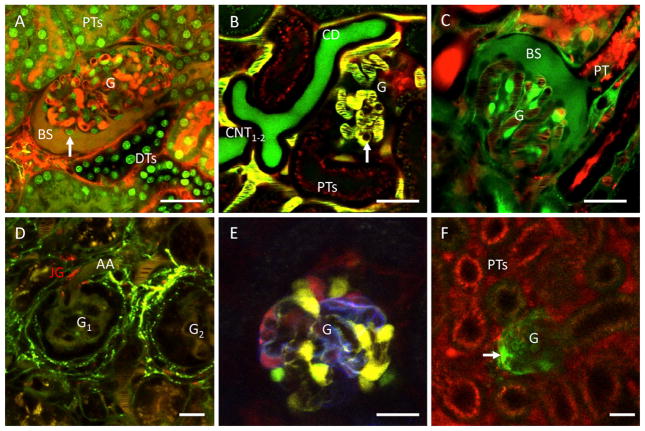
Fig. 1.
In vivo imaging of glomeruli in the intact mouse kidney. A: optical section of a glomerulus (G), and the adjacent proximal tubules (PTs), and distal tubules (DTs). Cell nuclei are intensely labeled by Hoechst33342 (green). Plasma was labeled by 70 kDa dextran-rhodamine B (red) and lucifer yellow (green), a freely filtered dye given in intravenous bolus. The Bowman’s space (BS) is visible in dark yellow from the mixture of filtered markers. Podocytes are visible around glomerular capillaries in negative (dark), based on their lack of fluorophore uptake (arrow). B: in vivo imaging of blood cells streaming in glomerular capillaries. In addition to the majority of unlabeled (dark) red blood cells, round shaped leukocytes are occasionally visible sticking and rolling in individual capillaries (arrow). Two adjacent connecting tubules (CNT1–2) are seen merging into their common collecting duct (CD). Plasma was labeled yellow by Alexa594-albumin (red) and Lucifer Yellow (green) given in IV bolus. Albumin uptake is visible in proximal tubule segments (PTs, red). C: In vivo labeling and imaging of glomerular endothelial cells and the glomerular and tubular basement membranes using positively charged Lucifer Yellow (green). The cell body of endothelial cells (most intense green), the typical linear network of glomerular and proximal tubular (PT) basement membranes (medium intensity), and the BS are labeled green by Lucifer Yellow. Plasma was labeled by 70 kDa dextran-rhodamine B (red). D: in vivo imaging of renin activity (green) in plasma and renal tissues. Two adjacent glomeruli (G1–2) and their afferent arterioles (AA) are clearly visible. Renin containing juxtaglomerular (JG) cells in the terminal AA are labeled red using LysoTracker-Red. Activity of the fluorogenic renin substrate (green) is visible in both the circulating plasma (intravascular space) and the renal interstitium (most intensely in the JG region around glomeruli). E: multicolor labeling of podocytes in the transgenic Podocin-Confetti mouse model, either by genetically encoded membrane-targeted CFP (cyan), nuclear GFP (green), cytosolic YFP (yellow) or cytosolic RFP (red). F: in vivo image of a single, sclerotic glomerulus (G) in a healthy Podocin–GCaMP3 mouse kidney. The genetically encoded calcium indicator GCaMP3 (green) is expressed and visible only in podocytes. High calcium (intense green) is detected in a subset of podocytes that invade the parietal Bowman’s capsule (arrow). Plasma was labeled by Alexa594-albumin (red) given in IV bolus. High albumin uptake is visible in this nephron’s proximal tubule (PT) segments. Bars = 20 μm.

