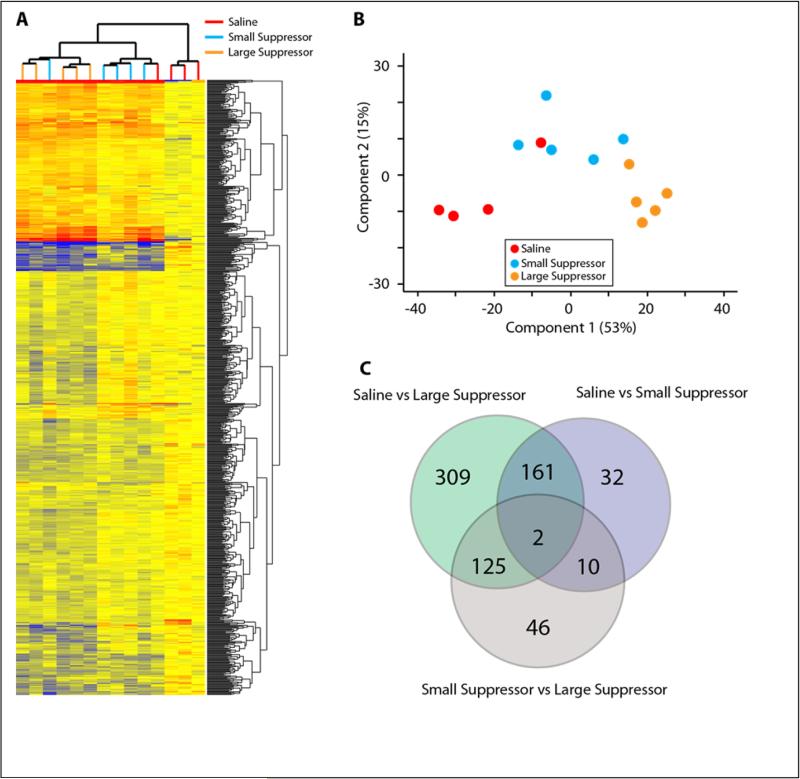
Figure 2. Identification of Differential Gene Expression by RNA-Seq.
A) Hierarchical clustering of genes and samples for the 685 differentially expressed transcripts (ANOVA, SNK pairwise posthoc, fold change >|1.25|. B) Relationship between samples through principal compenent analysis based on the differentially expressed genes. Samples segregated along the first compenet by group. C) Venn diagram representation of the differentially expressed transcripts. A number of common changes were observed between heroin groups and Saline and in the comparisons between Large Supressors and Saline and Small Suppressors. n=4-5/group

