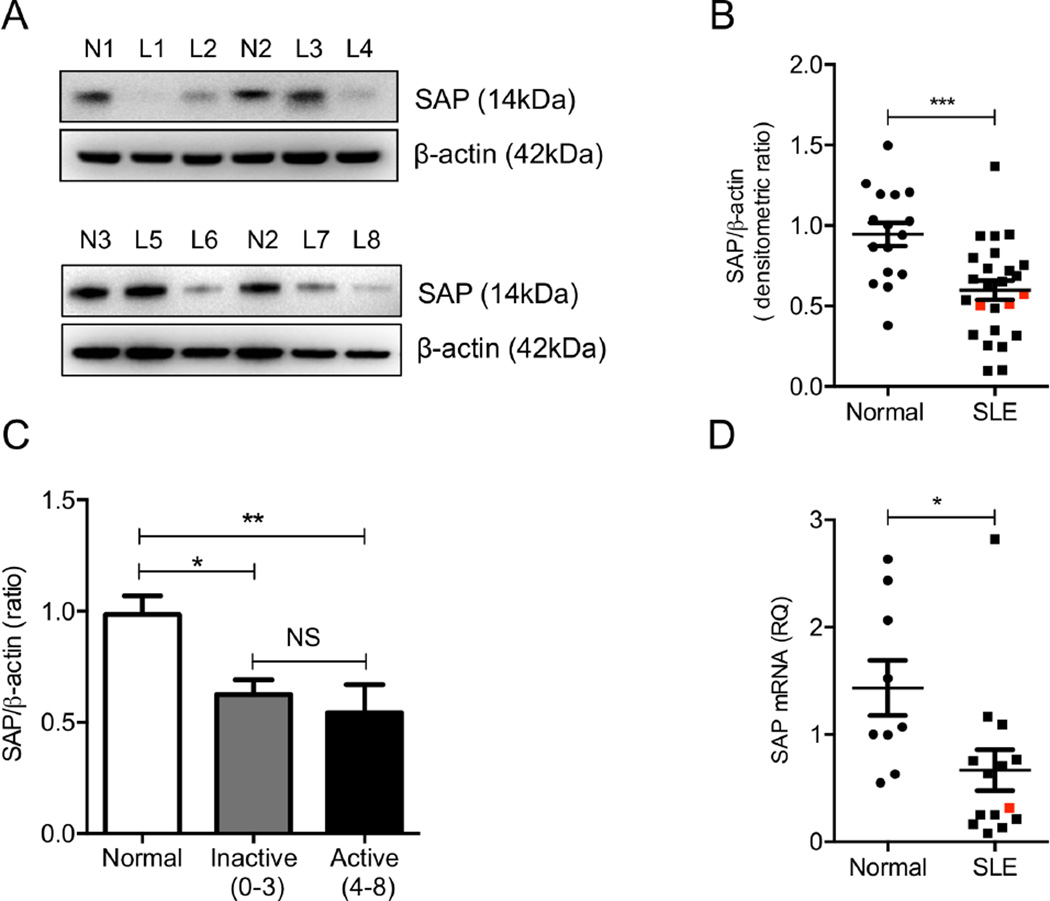
Figure 2. Levels of SAP in T cells from patients with SLE and from healthy individuals.
Protein levels of SAP were assessed in whole-cell lysates of T cells obtained from normal donors (n=16) and patients with SLE (n=25) by Western blotting. Two individual representative experiments are shown in (A) and cumulative results, expressed as the mean densitometric ratio of SAP over β-actin ± SEM, are depicted in (B). (C) SAP protein levels are found to be decreased in SLE patients with both inactive and active disease. SAP gene expression was evaluated with qPCR in 9 healthy donors and 14 patients with SLE and results are shown in (D). Red points signify men with SLE. N=Normal Donors and L= SLE patients.

