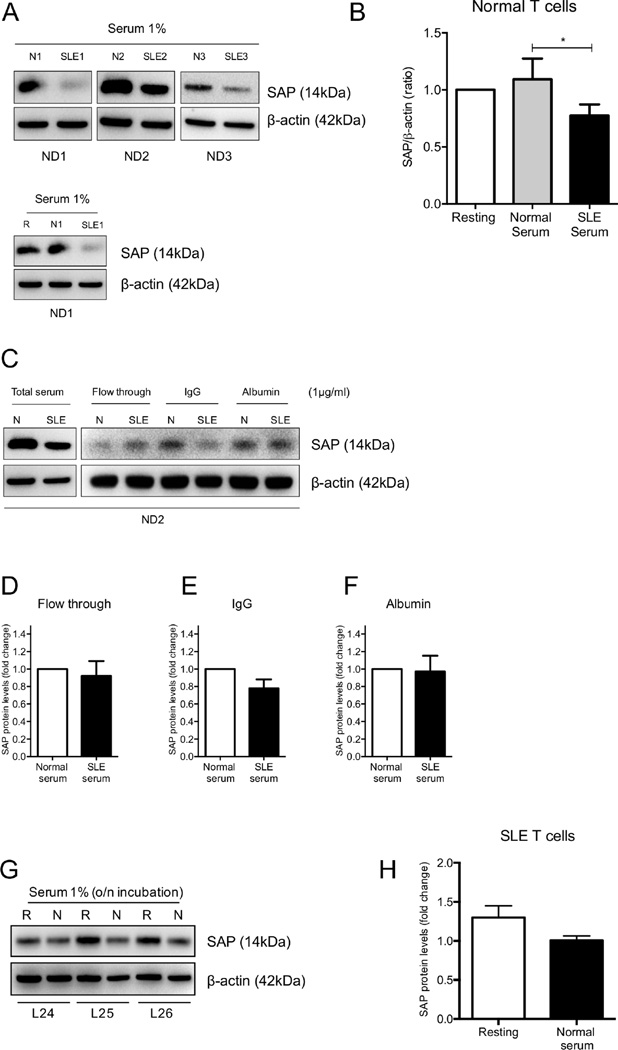
Figure 6. Treatment of normal T cells with SLE serum results in SAP downregulation in an IgG-dependent mechanism.
Normal T cells (n=6) were cultured in the presence of 1% serum from patients with SLE, healthy individuals or medium supplemented with 1% FBS for 6 h and SAP protein expression was examined with Western blot. Representative experiments are shown in (A) and cumulative results in (B). Normal T cells were exposed to normal or SLE serum (whole or fractionated) for 6 h and SAP levels were evaluated with Western blot in (C). (D, E and F) Cumulative results of SAP levels following incubation of healthy T cells with fractionated serum from normal donors and patients with SLE are expressed as the fold change of the densitometric ratio of SAP over β-actin ± SEM. Total T cells from patients with SLE (n=3) were exposed to 1% normal serum overnight. SAP levels were examined with Western blotting (G) and results are depicted in (H), expressed as the mean densitometric ratio of SAP over β-actin ± SEM. N=normal serum, SLE=serum from SLE patient, ND=T cells from Normal Donor, L=T cells from SLE patients and R=resting

