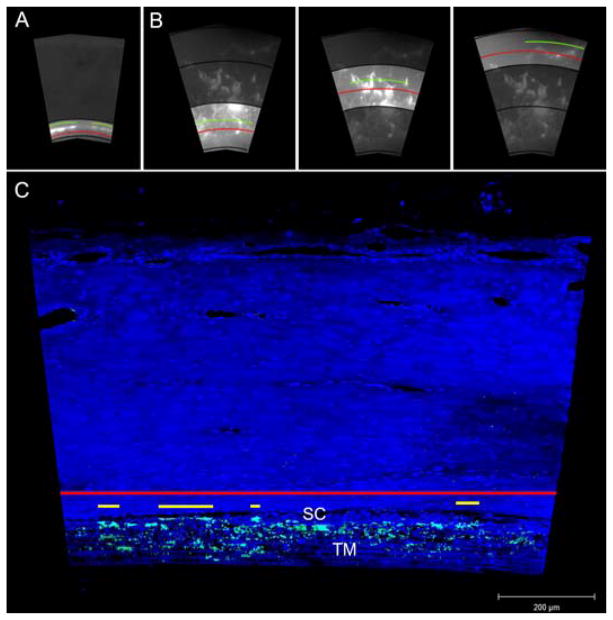
Figure 2. Methods of Effective Filtration Area Measurements.
A) EFA measurement using global images of the TM. EFA was measured in only one region. The red line represents the total TM length and the green line represents the filtration length. TM EFA (ΣFL/ΣTSL) was calculated for each eye. B) EFA measurement using global images of EPVs. EFA was measured in three distinct regions. The red line represents the total scleral length and the green line represents the length of sclera labeled with fluorescent tracers. EPV EFA (ΣFL/ΣTSL) was calculated for each eye. C) Measurement of EFA (ΣFL/ΣTL) along the IW of Schlemm’s canal using confocal images. The red line represents the total length of the IW and the yellow line represents fluorescent-decorated length of the IW. TM = trabecular meshwork; SC = Schlemm’s canal.

