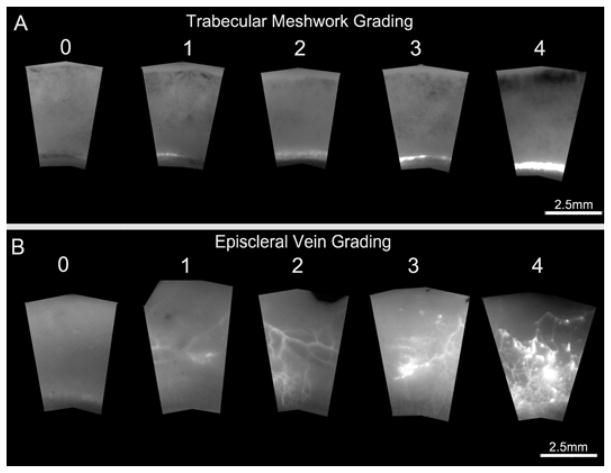
Figure 3. Semi-Quantitative Evaluation of Fluorescent Tracer Distribution and Intensity.
A) Grading scale representative of variations of tracer distribution and intensity in the TM. “0” represents TM devoid of tracers and “1 – 4” represents a combination of increasing tracer distribution and intensity in the TM. B) Grading scale representative of variations of fluorescent tracer distribution and intensity in EPVs. “0” represents EPVs devoid of tracers and “1 – 4” represents a combination of increasing tracer distribution and intensity in EPVs.

