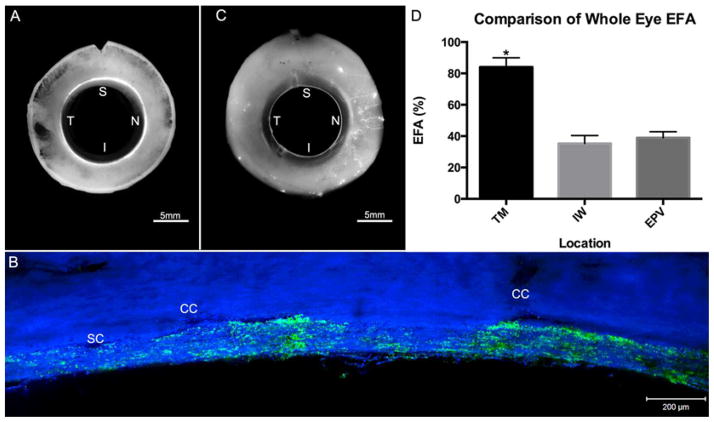
Figure 4. Comparative Analysis of EFA in TM, IW, and EPVs.
A) A global image of the TM showing segmental tracer distribution. B) A confocal image of frontal sections from the same eye showing segmental tracer distribution along the IW with more tracer seen near collector channel (CC) ostia. C) Global image of EPVs showing a more segmented pattern of outflow than the TM. D) EFA of the TM showed a significantly (*) higher value (86.3±3.5%) compared to both the IW (34.7±2.9%; p≤0.01) and EPVs (41.1±3.8%) (p≤0.01). No significant difference was found between EFA values of the IW and EPVs (p=0.12). SC = Schlemm’s Canal; CC = Collector channel. S = Superior; N = Nasal; I = Inferior; T = Temporal

