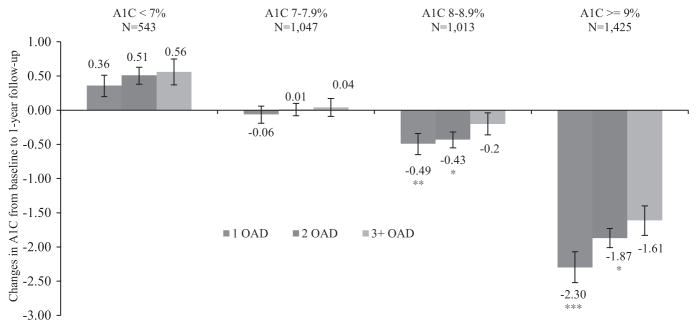
Figure 1.
Mean (standard error) reduction in glycosylated hemoglobin (HbA1c) at 1-year follow-up compared with baseline, after use of 1, 2, and ≥3 oral antidiabetes drugs (OADs) according to baseline HbA1c categories. Asterisks represent significant group differences from delayed insulin initiation (≥3 OADs) in mean HbA1c reduction according to insulin initiation category (1 OAD and 2 OADs) based on unadjusted ordinary least squares regression with inverse probability treatment weights: ***P ≤ .001; **P < .01; *P < .05.

