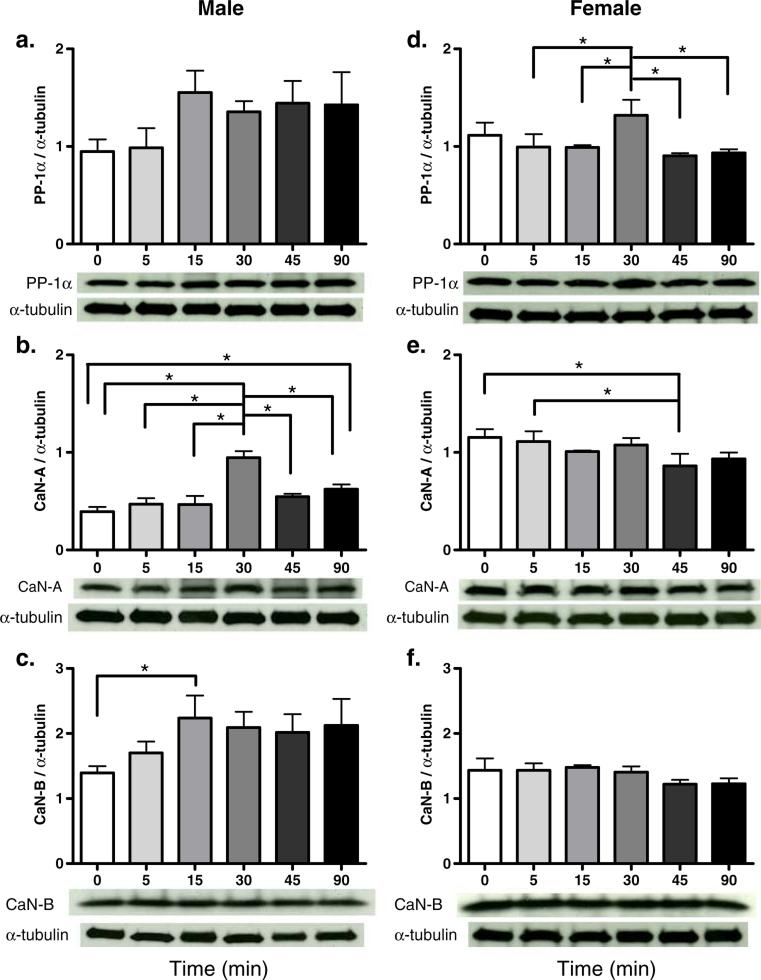
Fig. 2.
Protein levels of PP-1α (a, d), CaN-A (b, e), or CaN-B (c, f) after cocaine treatment in male (a–c) and female (d–f) rats. Data are presented as the mean protein levels normalized with α-tubulin ± SEM. Lower panel represents a typical Western blot for each protein. * Represents statistically significant difference (N=4 per group)

