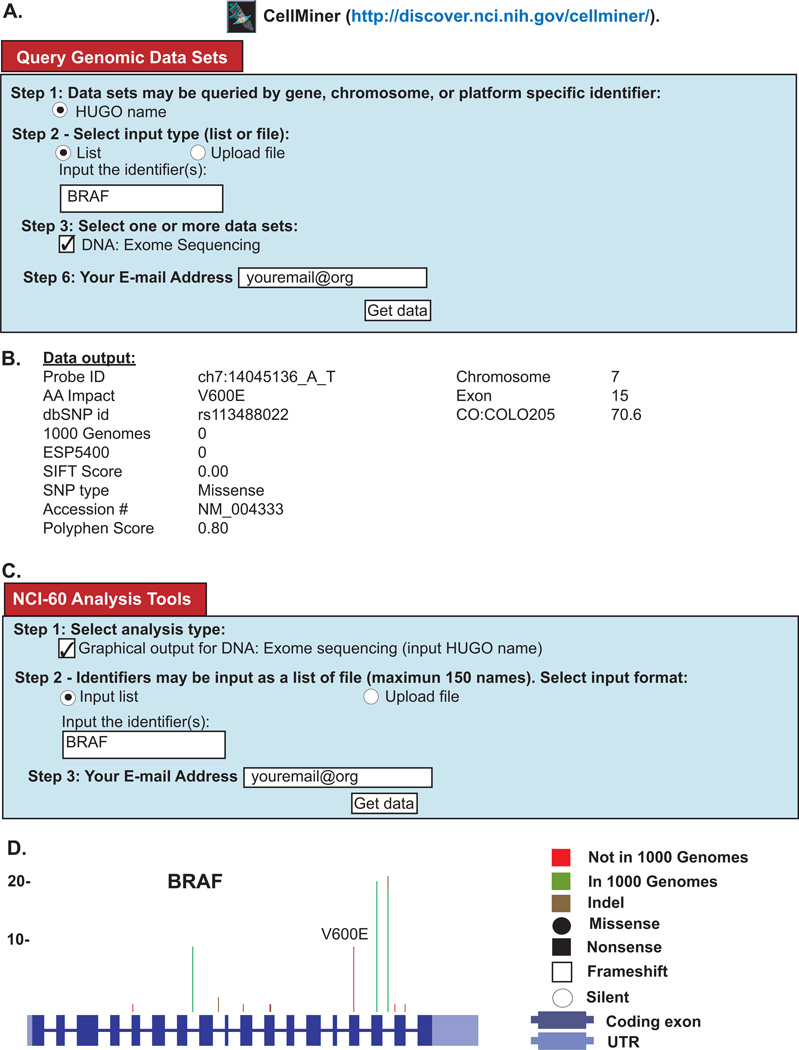
Figure 3. Snapshot from the Cell-miner Website.
Figure 3: Snapshot from the Cell-miner Website. (A) To access tabular data, first click on the “Query Genomic Data Sets” tab. Specify data you want by: i) identifying the query type in Step 1 (HUGO name is required); ii) choosing whether you wish to type in your identifier, or upload your identifier(s) as a file in Step 2; iii) identifying the data set being queried in Step 3 (in this case exome sequencing); iv) entering your E-mail address in Step 6; and clicking “Get data”. (B) The tabular data sent to you will include a full set of the data for all 60 cell lines (only one cell line is included for reasons of space). Within the output, i) The probe ID denotes the chromosome number, start location, and the nucleotide change, ii) AA is amino acid, iii) dbSNP id iv) allele frequency in 1000-genomes, v) allele frequency in ESP5400, vi) SIFT score, vii) NCBI accession number, viii) Polyphen2 score. (C) To access graphical data, first click on the “NCI-60 Analysis Tools” tab. Choose the graphical output tool by, i) clicking “Graphical output for DNA:Exome sequencing” in Step 1; ii) choosing whether you wish to type in a your identifier, or upload your identifier(s) as a file in Step 2; iii) identifying the gene being queried, also in Step 2; iv) entering your E-mail address in Step 3; and clicking “Get data”. (D) The graphical data will be sent as an html, with accompanying pngs. The summary of all variants in BRAF is shown (individual cell lines are also included). The number of variants at each location are depicted by the vertical green, red, or brown lines.

