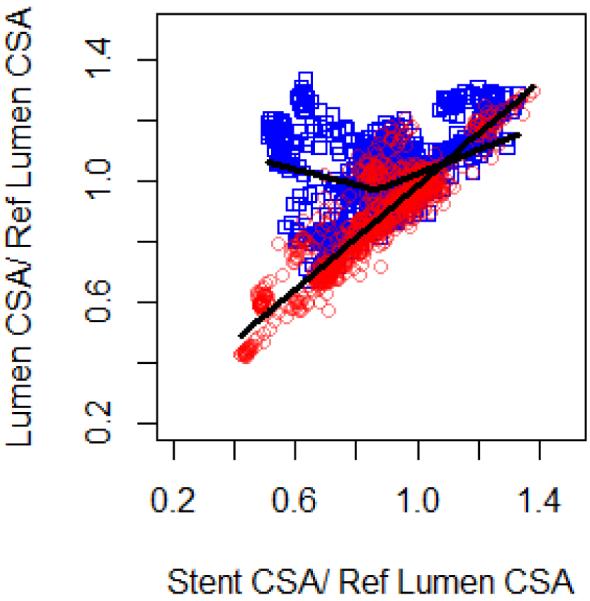
Figure 4.

Normalized lumen CSA (lumen-to-mean vessel reference lumen area ratio) versus stent expansion ratio (stent-to-mean vessel reference lumen area ratio) at baseline (blue) and follow up (red), with piecewise linear regression lines plotted of the fixed effects estimates after adjustment for measurements nested in vessels and animals.. For day 0 optimal knots in the piecewise linear model were found at stent expansion ratio = 0.86 (Stent expansion ratio = 86%; R2 = 0.85). Follow-up showed strong, linear and positive correlation between stent and lumen cross-sections (R2 = 0.94).
