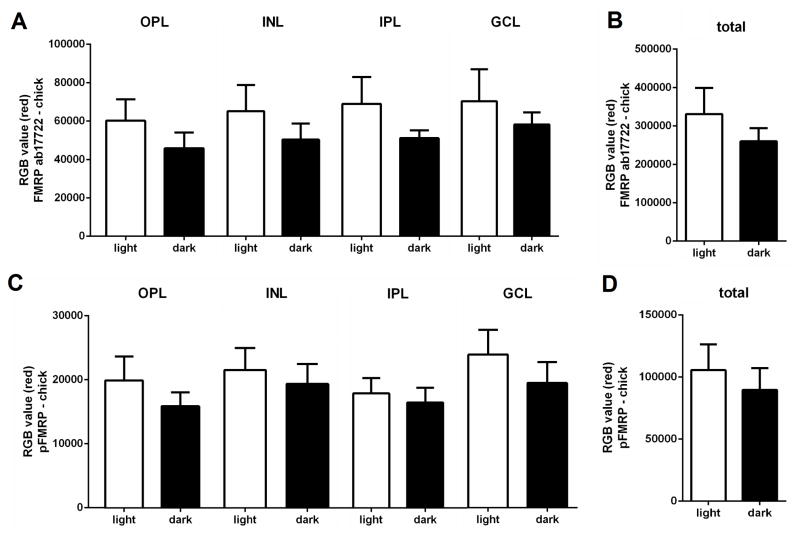
Figure 8. FMRP immunofluorescence measures in the chick retina layers.
A) Quantification of FMRP immunofluorescence in the retinal layers of chicks exposed to light for 1h after 24h in the dark versus chicks kept in the dark (mean of red value±SEM, light vs dark); OPL=60168±11190 vs 45791±8293; INL=65192±13652 vs 50324±8356; IPL=68965±13939 vs 51119±4018; GCL=70356±16586 vs 58239±6285). B) Quantification of total FMRP immunofluorescence in the chick retina, light vs dark; 330977±68067 vs 260017±34414. C) Quantification of pFMRP immunofluorescence in the retinal layers of chicks, light vs dark; OPL=19936±3754 vs 15899±2164; INL=21567±3417 vs 19376±3136; IPL=17905±2383 vs 16490±2281; GCL=23931±3888 vs 19499±3278. D) Quantification of total pFMRP immunofluorescence in the chick retina, light vs dark; 105579±20669 vs 89730±17405.

