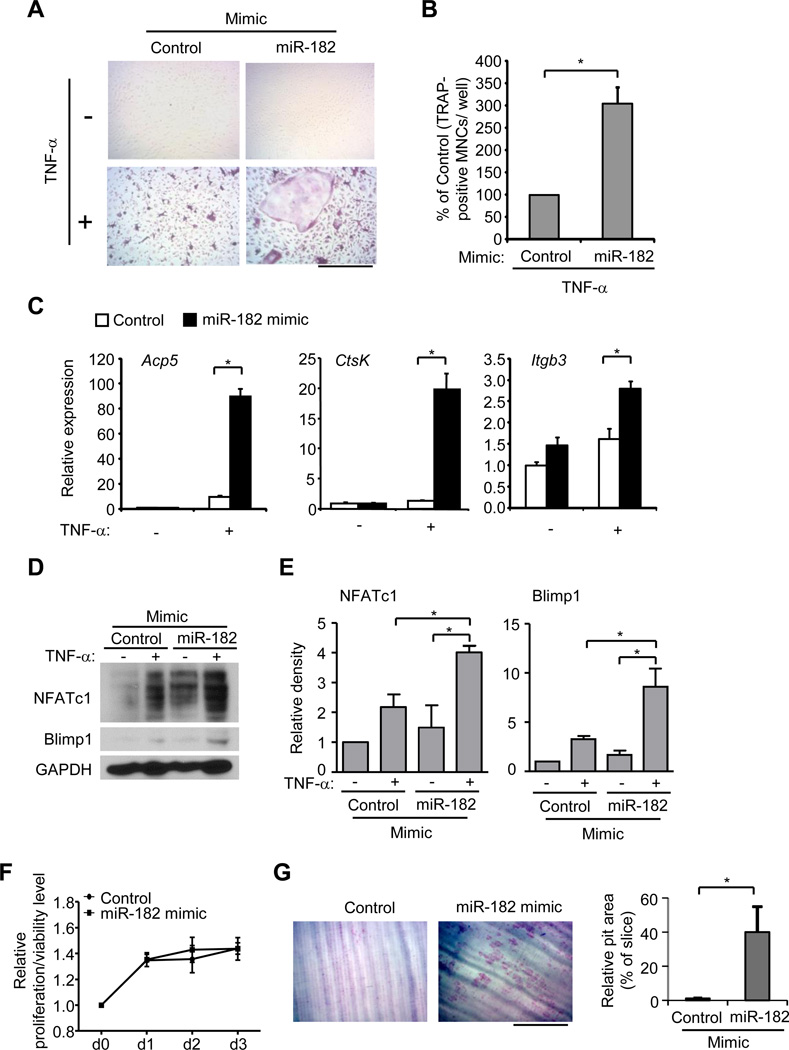
Figure 3. Forced expression of miR-182 significantly enhances TNF-α-induced osteoclastogenesis.
Wild type BMMs transfected with either control or miR-182 mimic (10 nM) were stimulated with TNF-α for 4 days. TRAP staining was performed (A) and the number of TRAP-positive MNCs (>= 3 nuclei per cell) per well relative to the control was calculated. Data in figure represent average ± SEM of three independent experiments and statistical significance was calculated by paired-t-test *P<0.05 (B). Bar, 200 µm. (C) Quantitative real-time PCR analysis of mRNA expression of Acp5 (encoding TRAP), Ctsk (encoding cathepsin K) and Itgb3 (encoding β3) in BMMs transfected with control or miR-182 mimic and stimulated with or without TNF-α for 3 days. Data are representative of and statistical testing was performed on at least three independent experiments. **P<0.01. (D) Immunoblot analysis of NFATc1 and Blimp1 expression in whole cell lysates obtained from BMMs transfected with control or miR-182 mimic (10 nM) with or without TNF-α for 3 days. GAPDH was measured as a loading control. (E) The relative density of the immunoblot bands of NFATc1 and Blimp1 vs. those of loading control GAPDH from three independent experiments were quantified by densitometry and normalized to the unstimulated control condition. *P<0.05. (F) Cell proliferation/viability at 0, d1, d2 and d3 with control or miR-182 mimic (10 nM) transfection was examined by MTT assay (refer to Methods for details). (G) Toluidine blue-stained dentin resorption pits (left panel) formed by the osteoclasts derived from wild type BMMs transfected with control or miR-182 mimic (10 nM) in the presence of TNF-α (40 ng/ml) for 10 days. Bar, 200 µm. Relative pit area (% to slice) is shown in the right panel. Data are representative of and statistical analysis was performed on three independent experiments. *P<0.05.

