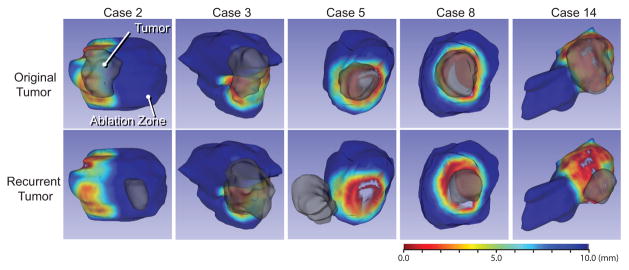
Fig. 4.
Three-dimensional color maps of distance map between the original tumor and ablation zone are rendered on the surface of ablation zone for the cases with local recurrences. The red areas represent insufficient ablation margin. The 3D models of original (upper) and recurrent (lower) tumors are superimposed. The red areas represent ablation margins with a thickness close to zero.

