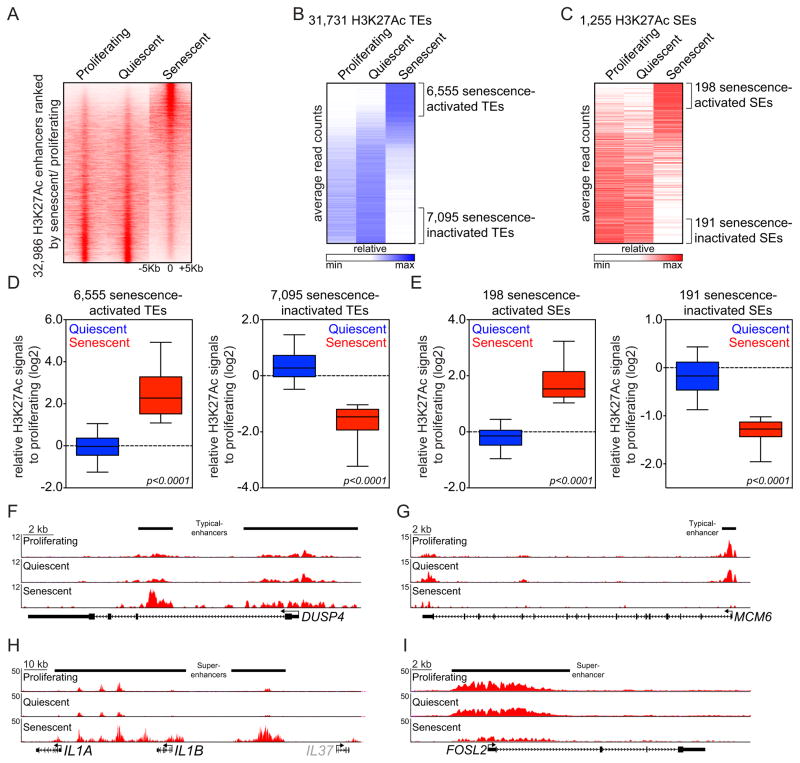
Figure 1. OIS is accompanied by global remodeling of enhancers.
(A) Heat maps showing H3K27Ac ChIP-Seq signals over the 32,986 H3K27Ac-enriched union enhancers identified in proliferating, quiescent and senescent IMR90 cells. Rows correspond to ±5Kb regions across the midpoint of each H3K27Ac-enriched union enhancer, ranked by increased H3K27Ac signal in senescent cells versus proliferating cells. Color shading corresponds to the H3K27Ac ChIP-Seq read count in each region.
(B and C) Heat maps illustrating average read counts (normalized for total number of reads per region) of H3K27Ac signals over ± 5-Kb regions centered around 31,731 typical enhancers (TEs) (B) and 1,255 super-enhancers (SEs) (C) in the indicated conditions. Senescence-activated or -inactivated enhancers marked by brackets were defined as H3K27Ac-enriched union enhancer regions exhibiting a greater or less than two fold change in H3K27Ac signals in senescence versus proliferating cells, respectively.
(D and E) Box plots showing relative changes in H3K27Ac signals in the indicated enhancer regions from quiescent (blue) and senescent (red) cells when compared to proliferating counterparts. Senescence-activated or -inactivated TEs (D) and SEs (E) were defined as described above. Fold changes with log2 scale (y-axis) were calculated by dividing H3K27Ac tag counts from quiescent or senescent conditions by H3K27Ac tag counts from proliferating condition. Significance was determined using a two-tailed t test. (F–I) H3K27Ac ChIP-Seq occupancy profiles at representative loci of senescence-activated (F and H) and senescence-inactivated (G and I) TEs (F and G) or SEs (H and I). Black bars above gene tracks denote TEs or SEs. Grey color on IL37 gene indicates it is not substantially expressed based on RNA-Seq data.

