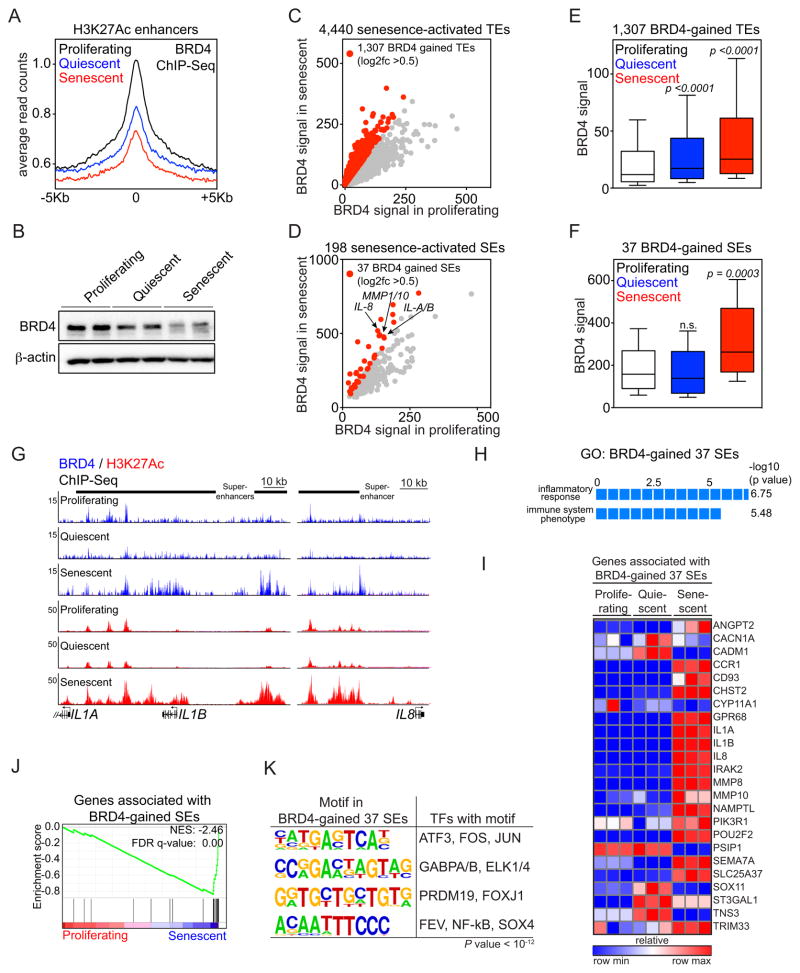
Figure 3. BRD4 is recruited to senescence-activated SEs associated with SASP genes.
(A) BRD4 ChIP-Seq enrichment meta-profiles in proliferating (black), quiescent (blue) and senescent (red) IMR90 cells, representing the average read counts per 20-bp bin across a 5-Kb window centered on all 32,986 union H3K27Ac enhancers.
(B) Immunoblot analysis of BRD4 and β-actin (loading control) in whole cell lysates from proliferating, quiescent and senescent cells.
(C and D) Scatterplots of absolute BRD4 signals (tag counts) at senescence-activated TEs (C) or SEs (D) in proliferating (x-axis) and senescent (y-axis) cells. The 1,307 TEs and 37 SEs showing a greater than 0.5 fold change (log2 scale) in BRD4 signals in senescence versus proliferating cells are marked in red. (E and F) Box plots of absolute BRD4 signals at the indicated enhancer loci in proliferating (white), quiescent (blue) or senescent (red) cells. P-values were calculated by comparing absolute BRD4 ChIP-Seq signals at 1,307 BRD4-gained TEs (E) or 37 BRD4-gained SEs (F) in proliferating cells versus quiescent or senescent counterparts using a two-tailed t-test. Normalized tag counts of the BRD4 ChIP-Seq is provided in Table S2.
(G) ChIP-Seq occupancy profiles for BRD4 (blue) and H3K27Ac (red) at IL1A/IL1B and IL8 locus at indicated conditions. Black bars above gene tracks denote SEs. The IL1A and IL1B H3K27Ac plots are data from Fig. 1H.
(H) GREAT GO analysis of 37 BRD4-gained SEs.
(I) Heat map showing the relative expression of genes associated with the 37 BRD4-gained senescence-activated SEs in proliferating, quiescent or senescent IMR90 cells.
(J) GSEA of the genes associated with 37 BRD4-gained SEs with proliferating and senescent conditions. Genes associated with BRD4 binding sites were defined as described in Fig. 2.
(K) Motif analysis of 37 BRD4-gained SEs for putative transcription factor binding sites. A 1-Kb region centered on BRD4 peaks was used for motif discovery. Motifs with p-value less than 10−12 were considered as significant candidates.

